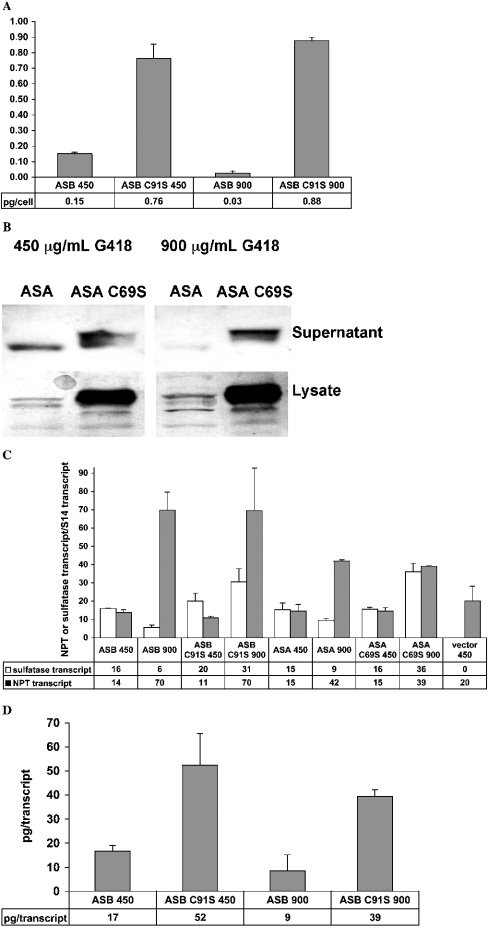
Figure 1. Quantification of sulphatase proteins and transcripts.
(A) Specific productivity of stably transfected pools of cells expressing either ASB or ASB C91S at 450 μg/ml G418 and 900 μg/ml G418. The medium was conditioned for 48 h before harvest. Samples were taken from duplicate T-25 flasks and clarified by centrifugation. Quantities of ASB and ASB C91S in the conditioned media were assayed in duplicate by ELISA as described in the Materials and methods section. Cell numbers were measured twice with a Coulter counter and averaged. The S.D. of total cells per well for all wells tested was 20% of the mean. Units for the y-axis are total pg of ASB or ASB C91S in the medium per cell at the end of the 48 h incubation period. Means±S.D. are shown. (B) Western blots of secreted (supernatant) and intracellular (lysate) protein preparations from pools of stably transfected CHO cells expressing ASA or ASA C69S. Equal amounts of protein, as determined by Bradford assay, were loaded in each well of an SDS/PAGE gel. Gels were blotted and probed with the anti-ASA antibody as described in the Materials and methods section. Samples from duplicate flasks of cells expressing ASA or ASA C69S were compared, with representative lanes shown. (C) Normalized NPT and sulphatase transcript levels obtained from pools of stably transfected cells selected at either 450 μg/ml G418 (450) or 900 μg/ml G418 (900) and expressing different sulphatase proteins. Cells were trypsinized, washed with DPBS and pelleted before isolation of RNA and reverse transcription as described in the Materials and methods section. QPCR was done in triplicate with means and S.D. shown. The hamster ribosomal S14 transcript was also quantified as an internal control for each RNA sample. NPT and sulphatase transcript levels between samples were normalized with the internal S14 controls. (D) Ratio of ASB or ASB C91S protein in conditioned medium per ASB or ASB C91S transcript within pools of stably transfected cells. Samples were taken from duplicate T-25 flasks. ASB proteins in the different samples were quantified in duplicate by ELISA and normalized to cell number measured twice with a Coulter counter as described in (A); transcript levels in total RNA isolated from each flask of cells were quantified by RT–QPCR and normalized to the ribosomal S14 internal standard as described in (C). RT–QPCRs were run in triplicate on each RNA sample. The units of the y-axis are pg of protein per transcript encoding the protein.

