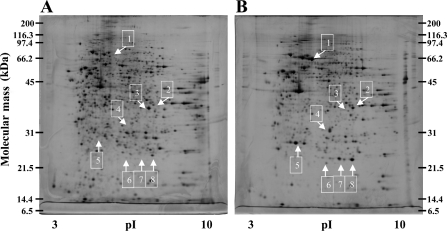
Figure 1. Representative gel images of LECs treated with or without 40 μM arsenite for 24 h visualized by two-dimensional gel (12.5%) and silver staining.
(A) Control LECs and (B) LECs treated with 40 μM arsenite. Differentially expressed proteins are numbered from 1 to 8 and indicated by arrows. The protein spots were excised, in-gel-digested with trypsin and analysed by MALDI–TOF-MS.

