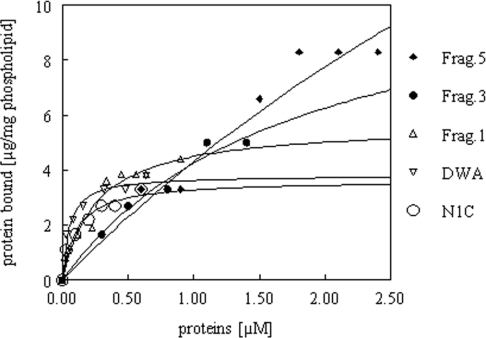
Figure 3. Binding of increasing concentrations of purified, fluorescently labelled full-length ankyrin-binding domain and its mutants by PE/PC (3:2) FAT-liposomes.
Curves were fitted by non-linear regression according to the equation B=Bmax×free/KD+free. B and Bmax denote protein bound; the concentration of free protein is given in mol/l. Details in are given in the Materials and methods section.

