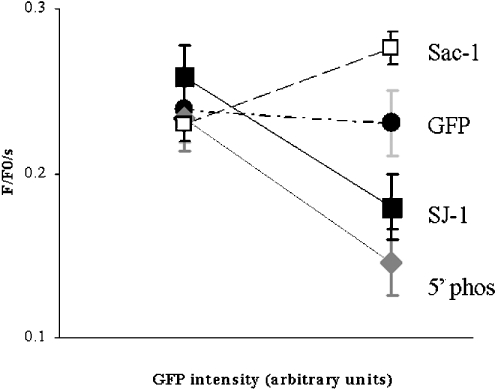
Figure 5. Ca2+ flux rates in CHO cells expressing phosphoinositide phosphatases as a function of protein expression.
The fraction of cells with fluorescence intensity between 15 and 120 arbitrary units, designated as low expression, are displayed by the points on the left. The fraction of cells with fluorescence intensity between 121 and 255 arbitrary units, designated as high expression are displayed by the points on the right. With GFP expression only (•), there was no significant difference in the average Ca2+ flux rate of cells with high and low expression levels [0.24±0.02/s (n=16) versus 0.23±0.02/s (n=41)]. There was a decrease of the Ca2+ flux rate at high SJ-1 expression levels from 0.26±0.02/s (n=24) to 0.18±0.02/s (n=25). An even more pronounced decrease could be observed with 5-Pase expression from 0.23±0.02/s (n=20) to 0.13±0.02/s (n=6). When expressing full-length Sac1, there was a change from 0.23±0.02/s (n=52) to 0.28±0.02/s (n=88).

