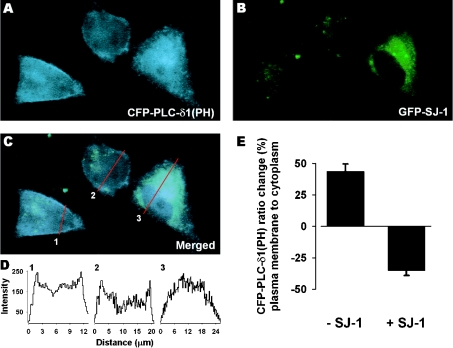
Figure 7. Plasma membrane expression of CFP-PLC-δ1(PH) in CHO cells.
CFP-PLC-δ1(PH)-transfected cells (A) with one cell co-transfected with GFP-SJ-1 (B). The merged image of (A) and (B), shown in (C), reveals less membrane signal in the cell overexpressing GFP-SJ-1. (D) Cross-section intensity plot (indicated by red lines) of CFP-PLC-δ1(PH) distribution (C). (E) Ratio change of CFP-PLC-δ1(PH) emission intensity in percentage between regions along the plasma membrane and covering the cytoplasm in either non-transfected cells (n=14) or GFP-SJ-1-transfected cells (n=8). Results are represented as means±S.E.M.

