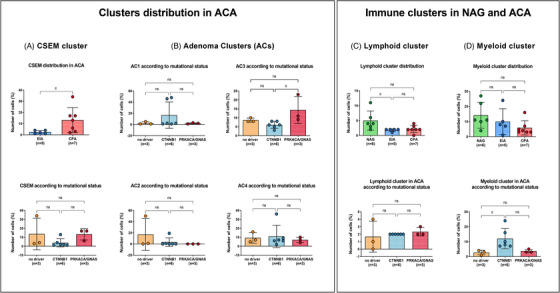
FIGURE 7.

Cluster distribution in ACA samples across subtype and mutational status. Distribution of (A) cholesterol‐and steroid‐enriched metabolism (CSEM) cluster in cortisol‐producing adenomas (CPA) versus endocrine‐inactive adenomas (EIA; upper panel) and across mutational status (lower panel); (B) Adenoma clusters (AC1‐4) across mutational status; (C) Lymphoid cluster across subtypes (upper panel) and mutational status (lower panel); (D) Myeloid cluster across subtypes (upper panel) and mutational status (lower panel). Significant cluster enrichments are encircled in red.
