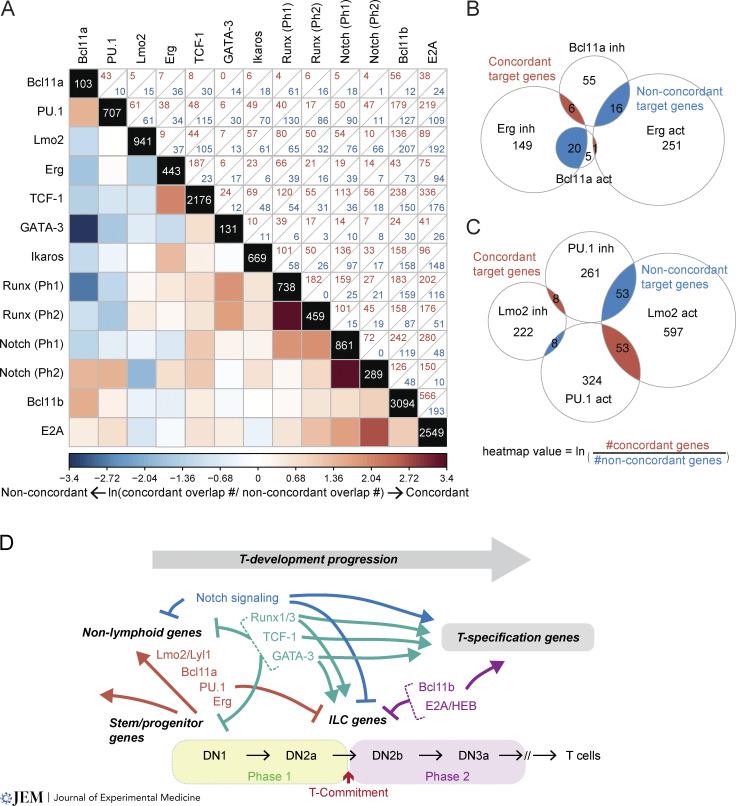
Figure 4.
Converging and opposing actions of TF pairs on shared target genes. (A) The heatmap illustrates converging (more red) or opposing (more blue) activities of two TFs on their common targets as a natural log of the ratio between numbers of genes that are regulated concordantly (both TFs activate or both inhibit) versus non-concordantly (one activates and the other inhibits). Zero counts were replaced with 0.5 for logarithmic transformation, and natural log ratio values are shown from −3.4 to 3.4. Numbers in diagonal boxes display the total numbers of target genes for each TF. Upper right boxes enumerate joint targets with concordant (red) or non-concordant (blue) effects. Targets were determined in these studies: Zhou et al., (2022) for Bcl11a, PU.1, Erg, TCF-1, GATA-3; Ungerbäck et al. (2018) for PU.1; Hirano et al. (2021) for Lmo2; Arenzana et al. (2015) for Ikaros; Shin et al. (2021) and Shin et al. (2023) for Runx1 and Runx3 (Phase 1 DEGs include both gain-of-function and loss-of-function targets); Romero-Wolf et al. (2020) for Notch; Hosokawa et al. (2018b) for Bcl11b; and Miyazaki et al. (2017) and Xu et al. (2013) for E2A. (B and C) Area-proportional Venn diagrams provide examples of how TFs converge or oppose each other’s gene regulation and how the heatmap values are calculated. (B) Erg and Bcl11a: non-concordant target genes include Lmo2, Mef2c, Dntt, Egfl7 (Erg-inhibited, Bcl11a-activated), Nrgn, Gzmb, Thy1, and Cdkn1a (Erg-activated, Bcl11a-inhibited). (C) PU.1 and Lmo2: non-concordant target genes include T- and ILC-associated genes such as Tcf7, Zbtb16, Pou2af1, Gzma, Cxcr5 (PU.1-inhibited, Lmo2-activated), and Cd24a (PU.1-activated, Lmo2-inhibited). (D) Summary: T cell program emerges from a balance between T-specification and progenitor factors; roles of specific regulators distinguish between T and ILC programs.

