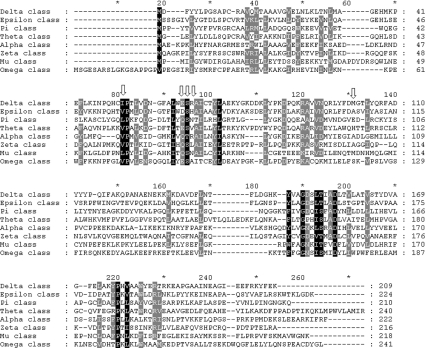
Figure 1. Amino acid alignments of several classes of GSTs.
Gaps introduced to maximize sequence similarity are shown by a horizontal dash. Black shadings represent 100% sequence similarity and gray shadings represent 80% sequence similarity. Vertical arrows indicate equivalent position of Ile-52, Glu-64, Ser-65, Arg-66 and Met-101 in Delta class. (GenBank® accession numbers are AF273039, NP_611323.1, A37378, NP_000844.1, NP_665683.1, O43708, NP_000552.1 and AH004172.1 respectively).

