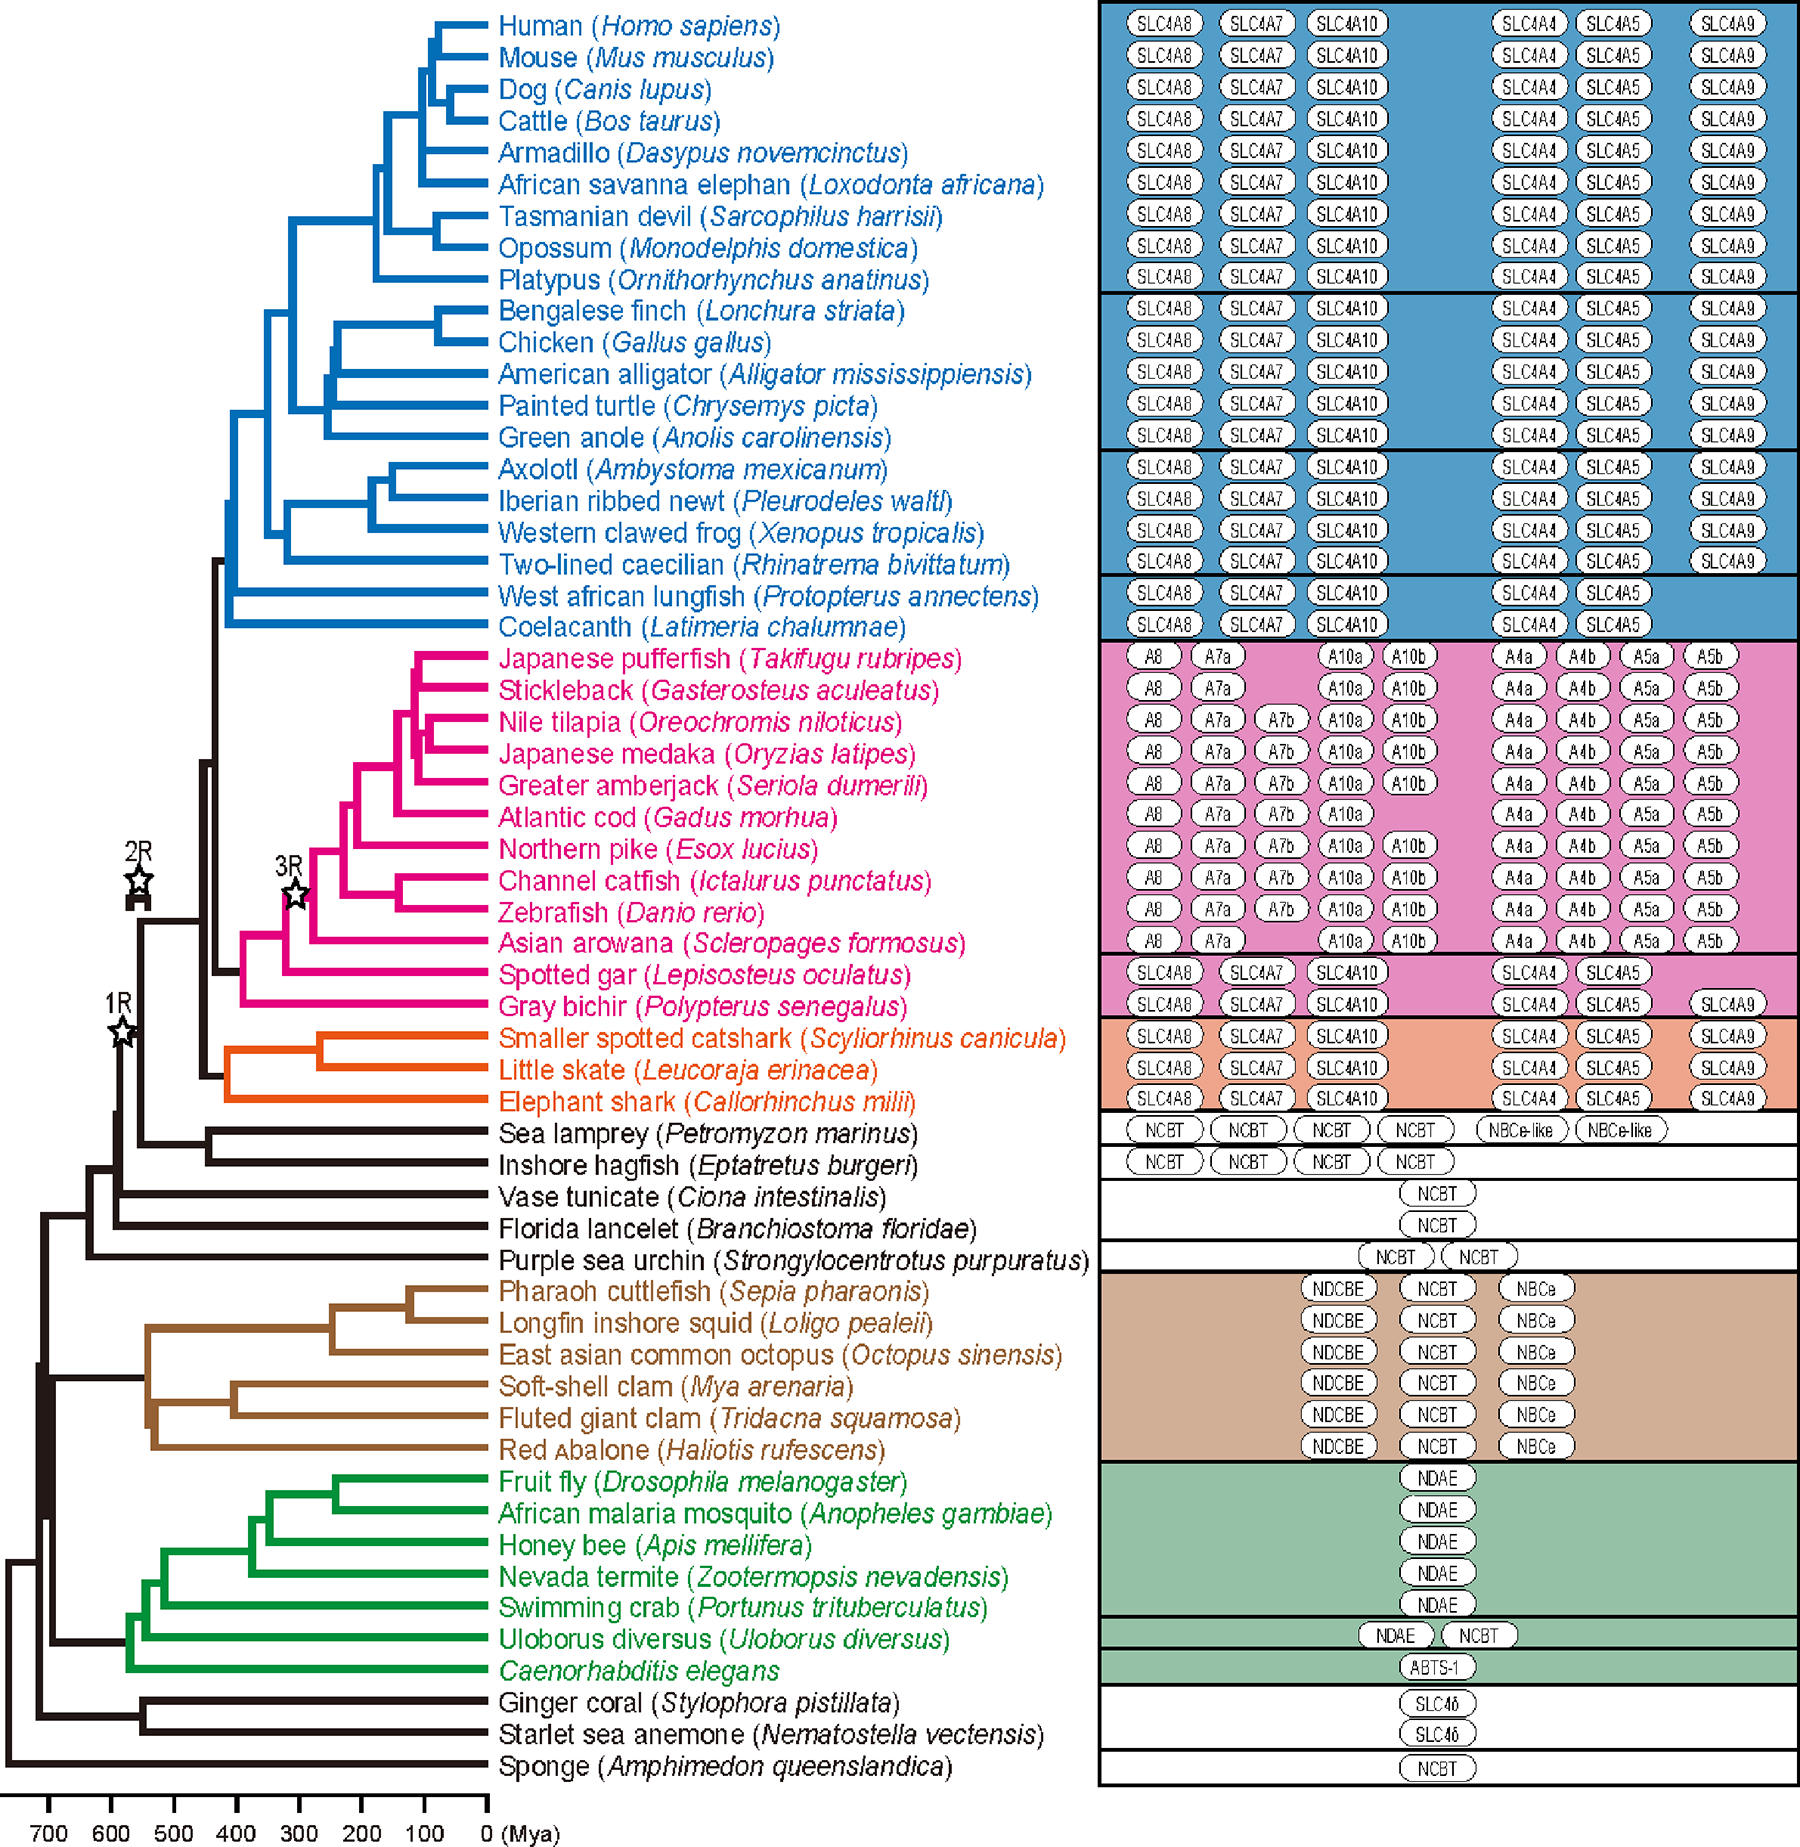
Figure 4. NCBTs in animals.

An overview of the distribution of NCBTs in the genome databases of various animal species are shown with the phylogeny of various vertebrate species based on the TimeTree database (http://www.timetree.org/) [97]. Tetrapods shown in blue section, teleosts shown in pink and orange, primitive fish shown in middle white section, mollusks shown in brown, insects, anilids and arthropods shown in green, and cnidaria shown in bottom white section. Open stars indicate the timing of three rounds of whole-genome duplication occurred in vertebrate evolution.
