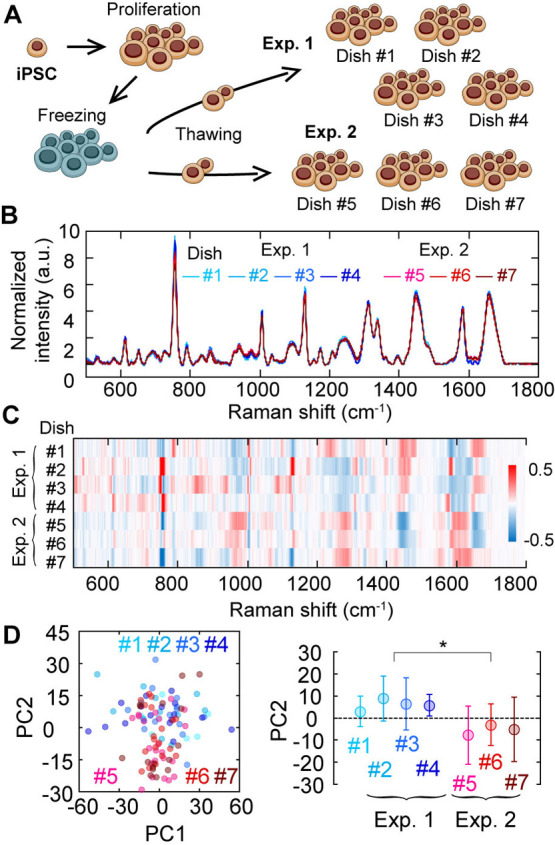
Figure 2 .

Pre-investigation of reproducibility in biological replicate. (A) Explanative cartoon of the investigation of biological-duplicate reproducibility. (B) Average Raman spectra of 253G1 hiPSC of seven dishes obtained in two distinct sample preparations. Different color, different dish. Blueness, the first preparation (Exp.1); Redness, the second preparation (Exp.2). (C) A heatmap of the differences from the total average spectrum among seven dishes. Total average spectrum calculated from all 7 dishes were subtracted from average spectrum of each dish (#1~#7). The color indicates the difference of mean spectrum of each dish and the average spectrum of all seven dishes. (D) Principal component analysis of Raman spectra of single cells in seven dishes. Color indicates each dish number. The left panel is PC2 vs PC1 plot and the right is the dish dependence of the PC2 value. Error bars are standard deviations. Asterisks indicate less than 0.05 of the p-value in the Student’s t-test.
