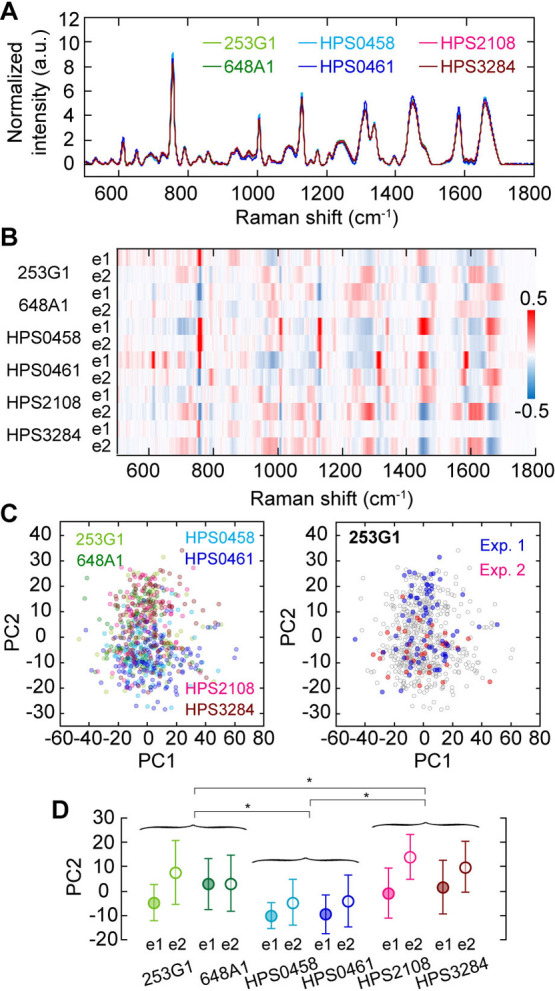
Figure 3 .

Comparison among average Raman spectra of six different hiPSC-lines. (A) Mean Raman spectra of six hiPSC-lines. Different color, different hiPSC-line. (B) A heatmap of the differences from the total averaged spectrum among six hiPSC-lines and two distinct sample preparations. The color indicates the difference of mean spectrum of each hiPSC-line and each preparation (e1 or e2) and the average spectrum of all 12 collections. (C) Principal component analysis of Raman spectra of single cells in six hiPSC-lines (left) and in two sample preparations of 253G1 (right). Different color, different hiPSC-line in the left panel. The gray plots in the right panel are superimpose of the left panel. (D) hiPSC-line and sample preparation dependences of the PC2 value in C. Error bars are standard deviations. Asterisks indicate less than 0.05 of the p-value in the Student’s t-test.
