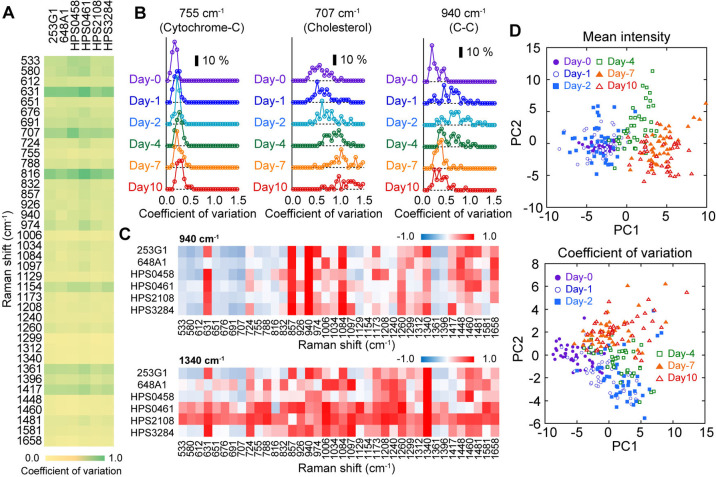
Figure 5 .
Coefficient of variation analysis of Raman spectra during myocardial differentiation of six hiPSC-lines before induction of differentiation (Day-0). (A) Spectra of coefficient of variation (CV) of six hiPSC-lines. Color from yellow to green correspond to value from 0 to 1.0. (B) Time developments of histogram of CV at the peaks of 755 cm–1 peaks (left), 707 cm–1 peak (middle) and 940 cm–1 peak (right). Scale bar indicates 10% frequency. All six cell-lines were used for analysis. (C) A heatmap of the correlations of time development of CV Correlation of CV time development between 940 cm–1 (upper) or 1340 cm–1 (lower) was calculated against other peaks and visualized. Color from blue to red correspond to value from –1.0 to 1.0. (D) Principal component analysis of mean intensity of Raman spectra in a dish (upper) and that of CV (lower). Each plot indicates each dish. Color is the same to Figure 4B.

