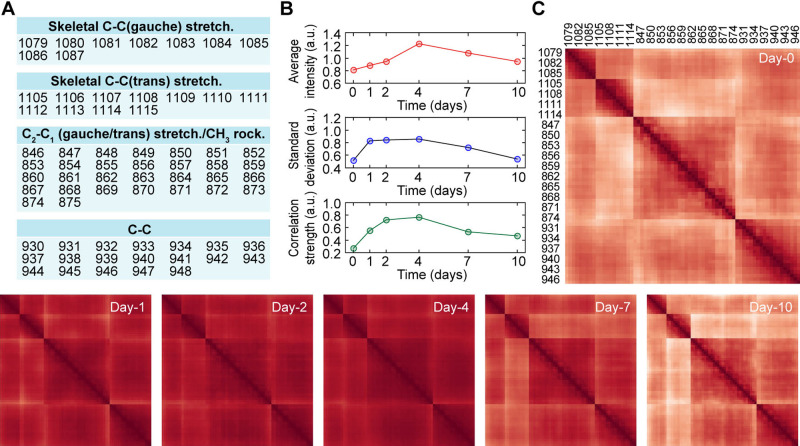
Figure 6 .
DNB analyses of Raman spectra during myocardial differentiation of six hiPSC-lines. (A) A table of dynamic network biomarker identified by the DNB analysis. The number indicates the wavenumber identified as a marker. (B) Time developments of average intensity (top), standard deviation (middle), and correlation strength (bottom) of the peak groups identified as the marker. The correlation strength does not include auto-correlation. (C) Time developments of heatmap of correlation between the identified markers. Darker, higher; lighter, lower.

