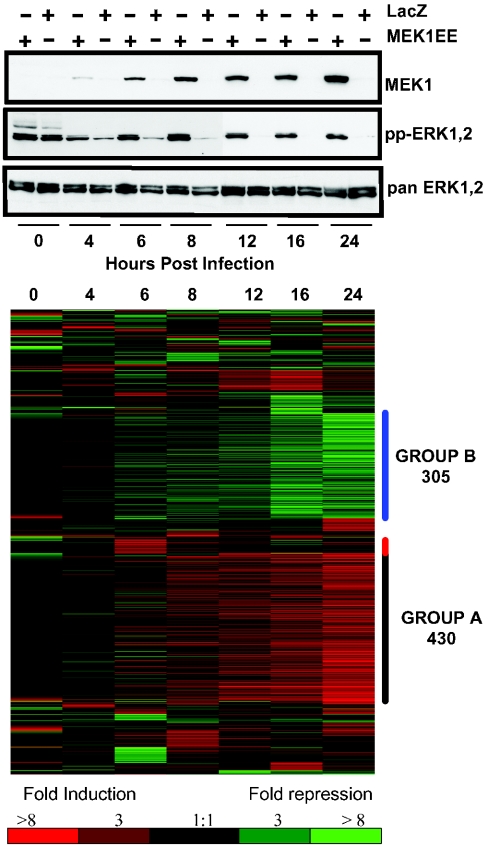
Figure 1. Expression of MEK1EE and activation of ERK1,2.
(A) MCF-12A cells were infected and cell lysates harvested for Western analysis in parallel with cells infected for array analysis. Total MEK1 protein was detected by immunoblotting with an anti-MEK1 antibody (upper panel). Blots were stripped and reprobed with antibodies specific for ppERK1,2 (dual-phosphorylated ERK1,2; middle panel) and total ERK (lower panel). (B) Heat map depicting detected increases (red) and decreases (green) in mRNA expression of genes represented by 1347 elements analysed across the seven time points. Comparisons were made between MEK1EE and LacZ mRNA levels for each time point.

