

Summary
Evolutionary adaptation of multicellular organisms to a closed gut created an internal microbiome differing from that of the environment. While the composition of the gut microbiome is impacted by diet and disease state, we hypothesized that vertebrates promote colonization by commensal bacteria through shaping of the apical surface of the intestinal epithelium. Here, we determine that the evolutionarily ancient FOXA transcription factors control the composition of the gut microbiome by establishing favorable glycosylation on the colonic epithelial surface. FOXA proteins bind to regulatory elements of a network of glycosylation enzymes which become deregulated when Foxa1 and Foxa2 are deleted from the intestinal epithelium. As a direct consequence, microbial composition shifts dramatically, and spontaneous inflammatory bowel disease ensues. Microbiome dysbiosis was quickly reversed upon fecal transplant into wild-type mice, establishing a dominant role for the host epithelium, in part mediated by FOXA factors, in controlling symbiosis in the vertebrate holobiont.
Keywords: Intestinal epithelium, FOXA, glycosylation, microbiome, inflammatory bowel disease
eTOC Blurb
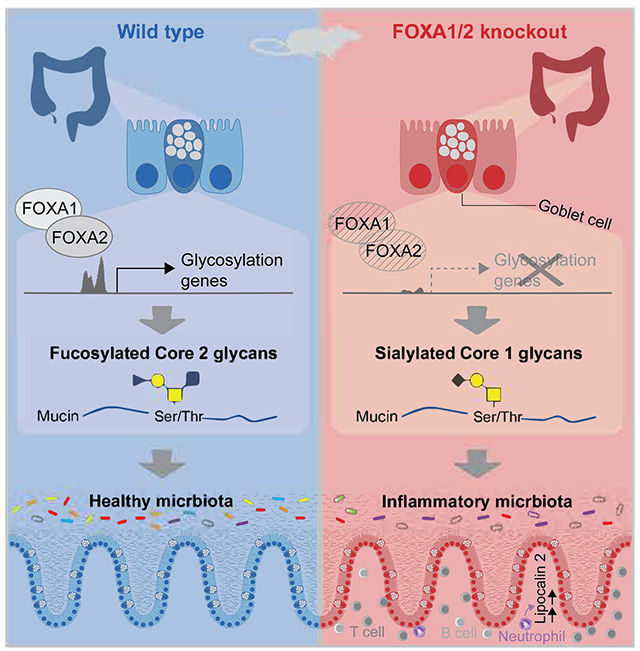
Swisa et al. identify FOXA transcription factors as crucial regulators of colonic glycosylation enzymes, with deletion of these factors causing altered mucus glycans, dysbiosis, and colitis. Efforts to restore a healthy microbiome through fecal transfer failed, underscoring the pivotal role of host glycans in determining the intestinal microbiome composition.
Graphical Abstract:
Introduction
Changes in the microbiome have been suggested as causative agents in multiple human diseases, from inflammatory bowel disease to diabetes and autism spectrum disorder1. For example, dysbiosis has been proposed to play a causative role in the pathophysiology of schizophrenia2. Microbiome composition as determined by 16S rRNA sequencing of fecal bacteria was found to be associated with subclinical inflammation and even neurostructural abnormalities. To approach causality, germ-free mice were transplanted with gut microbiota from patients with schizophrenia and behavioral abnormalities observed. Similar associations between the composition of the gut microbiome and disease states were made for coronary artery disease and heart failure3 and as well as others. As a consequence, ‘normalizing’ the gut microbiome through dietary intervention or fecal transplant have been proposed as therapeutic avenues for multiple diseases, which assumes a dominant and persistent role for the gut microbiota relative to the host biology in health and disease.
Given the fact that the animal ‘holobiont’, that is the complex system of host and multiple microbial communities, has co-evolved for at least 600 million years, we hypothesized that gene products expressed by colonic epithelial cells cooperate to establish a local environment favorable to beneficial bacterial taxa. To test this hypothesis, we focused on the evolutionarily ancient lineage-determining transcription factors of the FOXA clade, which are already present in the oldest animal species exhibiting a closed gut tube (see Discussion for details). Previous studies have highlighted the crucial role of FOXA transcription factors in regulating the differentiation of multiple endoderm-derived tissues during embryonic development4–7. Additionally, our earlier research demonstrated the significance of FOXA1 and FOXA2 in the differentiation of secretory cells in the gut8. In this study, we searched for a potential mechanism linking FOXA targets in the gut epithelium to physiological phenotypes.
Using cell-type specific gene ablation in the mouse colonic epithelium, we discovered that the FoxA factors function as master regulators of the epithelial glycosylation program, thus enabling symbiosis with favorable microbiota, which is required to maintain intestinal health and the well-being of the whole organism.
Results
Foxa1 and Foxa2 expression and ablation in the colonic epithelium
Single nuclei RNA-sequencing of the distal colon showed an enrichment for Foxa1 and Foxa2 transcripts in stem cells, secretory progenitor cells, and mature goblet cells (Figures 1A and S1), with highest expression in goblet cell progenitors. Multiplexed immunostaining combined with RNAscope confirms these findings, with both Foxa proteins expressed in the bottom half of the colonic crypt, overlapping with Ulex Europaeus Agglutinin I (UAE-1) lectin and Muc2 mRNA, both markers of goblet cells (Figure 1B, C). The Foxa genes are not expressed in the top half of the crypt where mature colonocytes, here labeled with MAO-A, reside (Figure 1B). In order to delete both Foxa1 and Foxa2 from the intestinal epithelium, we crossed Foxa1loxP/loxP, 4 and Foxa2loxP/loxP, 9 mice with Vil1-Cre mice10 (Figure 1D). These mice show complete ablation of Foxa1 and Foxa2 in the colon (Figures 1E–L) and will be referred to as DKO (double ‘knockout’) mice.
Figure 1: Expression and efficient deletion of Foxa1 and Foxa2 in the mouse colon.

(A) Foxa gene expression in the different lineages of the colonic epithelium of wild type mice as determined by snRNA-seq of distal colon (n=2). The bubble color represents the expression level of the gene, and the bubble size represents the number of cells expressing the specified gene in every cluster. LC, L-cells. EC, enterochromaffin cells.
(B) Colon tissue from wild-type mouse stained for FOXA1 (red), together with the goblet cell marker UEA-I lectin (green) and the colonocyte marker MAO-A (yellow), respectively, and Dapi to label nuclei (blue).
(C) Foxa2 (red) and Muc2 (green) RNA in situ hybridization, with E-cadherin (yellow) immunostaining and Dapi (blue) in colonic crypt from wild type mouse.
(D) Villin1-Cre; Foxa1loxP/loxP/Foxa2loxP/+ (Het) mice were crossed to Foxa1loxP/loxP/Foxa2loxP/loxP homozygous mice (used as control throughout), to generate homozygous deletion of Foxa1 and Foxa2 in the intestinal epithelium (DKO mice).
(E-J) Proximal and distal colon stained for FOXA1 and FOXA2. (E,G,I), FOXA1 (green); EPCAM (red); Hoechst (blue). (F,H,J), FOXA2 (green), E-cadherin (red), Dapi (blue).
(K) Foxa1 and (L) Foxa2 mRNA levels in control (n=5) and DKO (n=4) distal colon. Expression levels are obtained from bulk RNA-seq analysis. In boxplots: center line, median; box, first and third quartiles; whiskers, 1.5× IQR (interquartile range). ***p<0.001.
Deletion of Foxa1 and Foxa2 causes spontaneous colitis
Consistent with our previous findings8, FoxA DKO mice showed reduced body weight. This phenotype was not observed at birth but developed as early as one week of age (Figure 2A). No other obvious phenotypes were apparent during the first 7 months, neither physiologically nor histologically. However, pathological evaluation of older mice (> 7 months) identified a colitis phenotype, which was confined to the distal colon. The DKO colon exhibited pronounced inflammatory infiltrates, larger and more numerous lymphoid follicles with prominent germinal centers, crypt hyperplasia, and increased crypt length (Figures 2B–F). We confirmed crypt cell hyperplasia by labeling epithelial cell in S-phase using a short-term pulse of the thymidine analog EdU. We found the fraction of proliferating cells significantly increased in DKO mice, which is a likely consequence of the inflammatory status (Figure 2G–I). The inflammatory infiltrates were further confirmed by CD3 and CD45R immunostaining of T and B cells, respectively (Figures 2J, K).
Figure 2: FOXA-deficient mice develop spontaneous colitis.

(A) Body weight of control, heterozygous, and DKO mice over developmental time. Females; Control, n=40, Het, n=22, DKO, n=40. Males; Control, n=50, Het, n=28, DKO, n=28. Lines represent mean plus 95% confidence interval.
(B) Representative histology of distal colon from control (top) and DKO (bottom two) mice.
(C-E) Pathological scoring of inflammation (C), isolated lymphoid follicles (ILF, D), and crypt hyperplasia (E) of proximal and distal colon from control and DKO mice. n=7 per group.
(F) Crypt length of control and DKO distal colon. n=6 per group. Middle point and lines represent mean ± SD.
(G) Representative EdU staining in colonic section from control and DKO mice pulsed with EdU for two hours. Sections are stained for EdU (red), E-cadherin (green) and Dapi (blue).
(H-I) Quantification of EdU-labeled cells based on confocal images. The percentage of EdU positive nuclei in each crypt was calculated and presented as the median for each mouse (H, n=5) and as a distribution of all crypts (I).
(J) B-cells in colonic sections of control and DKO mice, stained with anti CD45R antibody.
(K) Colonic sections stained for T-cells with anti CD3 antibody.
(L) Fecal lipocalin-2 (LCN-2) levels in control (n=32), heterozygous (n=10), and DKO (n=38) mice of varying ages as indicated. In boxplots: center line, median; box, first and third quartiles; whiskers, 1.5× IQR with all samples, including outliers individually plotted. *, p<0.05, **, p<0.01, ***p<0.001.
We employed fecal lipocalin-2 (LCN-2), an established non-invasive marker of colitis in humans11 and in mice12, to follow disease progression. Unexpectedly, we observed high levels of LCN-2 in DKO mouse stool already at weaning (~three weeks of age), and these elevated LCN-2 levels were maintained throughout life of the mutant mice (Figure 2L). Taken together, these results suggest progressive inflammation in mice lacking Foxa1/2 in the gut epithelium starting before adulthood is reached, with histological signs developing later in life.
Decreasing bacterial load ameliorates colitis in FoxA DKO mice
Inflammatory bowel disease (IBD) is strongly associated with dysbiosis, or microbial imbalance in the gut13, and in several murine IBD models a beneficial outcome was documented following an antibiotic regimen14–18. To test the potential contribution of an altered microbiome to the inflammatory process observed in the DKO mice, we depleted gut bacteria using a cocktail of six antibiotics in the drinking water (Figure 3A). Five weeks of treatment led to a near-total depletion of gut bacteria, as indicated by a >100,000-fold reduction in bacterial DNA content in the stool as determined by 16S qPCR (Figure 3B). The antibiotic treatment reduced inflammation in DKO mice dramatically as seen by histology (Figure 3C), inflammation score (Figure 3D), and crypt hyperplasia score (Figure 3E). The normalization of epithelial proliferation following the antibiotic treatment was further confirmed by quantifying proliferating cells using Ki67 staining (Figure 3F). Immunostaining for inflammatory cells using anti-CD45 antibodies also showed a significant decrease in intraepithelial lymphocytes and fewer lymphoid follicles in the DKO colon following antibiotic treatment (Figure 3G). Lastly, fecal LCN-2 was reduced to basal levels as soon as two weeks after antibiotic administration in DKO mice (Figure 3H), confirming a significant improvement of the colitis phenotype. These results suggest that the DKO microbiome is involved in the colitis phenotype caused by the absence of Foxa1 and Foxa2 from the gut epithelium.
Figure 3: Depletion of the gut microbiome ameliorates colitis in FOXA-deficient mice.

(A) Study design and timeline. Antibiotics (ABX) were given to mice separated according to their genotype. Mice were 12–16 months old when started on the ABX. Stool samples were collected at indicated time points.
(B) Depletion of gut microbiome following antibiotic administration, as observed by 16S qPCR. Stool samples were tested before (Pre) and following five weeks of treatment. p-values were calculated separately for control and DKO mice.
(C) Representative histology of distal colon from control and DKO mice following five weeks of antibiotics treatment.
(D-E) Pathological scoring of inflammation (D) and crypt hyperplasia of distal colon from control and DKO mice following antibiotics.
(F) Proliferation rate of control and DKO colonic crypts from mice with or without antibiotics treatment, calculated from Ki67 immunostaining. The distribution represents the percentage of Ki67-positive nuclei in every crypt, counted from 100 crypts per group.
(G) Immunostaining for inflammatory cells, marked by CD45, in distal colon from the same mice as in (C).
(H) Fecal LCN-2 level before (Pre) and 2- and 5-weeks following antibiotics administration to control and DKO mice. In line graphs, middle point and lines represent mean ± SD, respectively. *, p<0.05, ****, p<0.0001.
One possible cause for intestinal inflammation is impaired barrier function, which we investigated next as we had previously reported that Foxa1 and Foxa2 play a role in the differentiation of gut secretory cells8. However, while goblet cell gene expression analysis of the DKO colon revealed a dramatic downregulation of goblet cell-enriched genes (Figures S2A–C and S3A–C), goblet cell abundance appeared normal by Alcian blue and PAS staining (Figure S2D–F) and quantification of MUC2 protein expression (Figure S2G,H). Mucus thickness was normal and there was no bacterial penetration into the epithelium (Figures S2I,J). In addition, epithelial barrier function assessed by the FITC-dextran permeability test (see Methods) was unaffected (Figure S2K). Altogether, while goblet cell differentiation is impaired in DKO mice as indicated by transcriptome changes, DKO goblet cells maintain adequate mucus secretion.
Microbial dysbiosis in FoxA DKO mice
The intact mucus barrier in the DKO mice and the strong response to the antibiotic treatment led us to hypothesize that microbial imbalance leads to the inflammation observed in these mice. To test this hypothesis, we performed bacterial 16S rRNA sequencing on fecal samples from control and DKO mice. For this analysis, we collected samples at multiple time points from weaning to 4 months of age, with mice housed separately according to their genotype from study day 0 (Figure 4A). Strikingly, our taxonomic analysis demonstrated a dramatic reduction in alpha, or within sample, diversity of DKO gut bacteria as measured by the Shannon index (Figure 4B, p=2.1e-05). Significant differences were observed even when the DKO mice were co-housed with controls at the beginning of the study (Figure 4C), despite the extensive coprophagy in mice. Principal coordinate analysis (PCoA) of the weighted UniFrac distance, a measurement of beta diversity, also showed dramatic differences between the two microbial communities (Figure 4D, p = 0.001 by PERMANOVA).
Figure 4: The colonic microbiome is dramatically changed in FoxA-deficient mice.

(A) Study design and sample collection timeline. Mice were co-housed until the day 0 time point, and then were separated by genotype. Samples were collected 6 times during the study.
(B) Alpha diversity of gut bacteria in control and DKO mice, represented by Shannon index.
(C) Shannon index for the initial time point (day 0) when mice of different genotype were still co-housed.
(D) Beta diversity of gut bacteria as shown by principal coordinates analysis (PCoA) of the weighted UniFrac distances between all samples. The percent variance of the data captured by each PCoA dimension is shown in the axes.
(E) Taxonomic abundance proportions in control and DKO mice. Data are represented by bacterial families or orders (specified by the ‘-ales’ suffix) and are shown for minimal mean abundance of 1%. Asterisks denote statistically significant differences between DKO and control. † indicates a similar trend as seen in human IBD26.
(F) Change in logit-transformed relative abundance of taxa shown in (E) in DKO mice vs. controls. Color code is identical to (E).
(G) Relative abundance of specific taxa, represented longitudinally during the course of the study.
When interrogating the microbiome data at the taxonomic level, bacterial families from the three most abundant phyla in the mouse colon, Bacteroidetes, Firmicutes and Proteobacteria, were dramatically changed. Most families from the Bacteroidetes phylum, with S24–7 representing the largest family in our mice, were decreased in abundance (FDR=3.8e-05), while Bacteroides, known for its adjustability to varying carbon sources, were increased19–22. We also observed an increase in Proteobacteria, attributed to the Sutterella genus (included in the Alcaligenaceae family in our data), which is commonly accepted as a hallmark of dysbiosis23–25. Families from the Firmicutes phylum also showed dramatic changes with an overall increase of phylum abundance (Figures 4E–G). Of note, some families, especially from the Clostridiales order, showed a similar trend of change as often observed in IBD26 (Figure 4E). These striking differences were present even when mutants were cohoused with control mice (study day 0 in Figure 4G) and were maintained for the entire length of the study (Figure 4G). These results demonstrate massive dysbiosis in the FoxA-deficient colon and support the involvement of colonic bacteria in FoxA deficiency-mediated colitis.
The FOXA proteins activate a network of glycosylation enzymes
In order to identify the molecular targets of FOXA proteins that contribute to the dysbiosis and possibly the colitis phenotype in Foxa1/2 deficient mice, we investigated transcriptome changes in the colon of DKO mice and identified direct FOXA1/2 targets using ChIP-Seq. Consistent with the colitis phenotype, we observed robust upregulation of inflammatory genes in the distal colon of DKO mice (Figure S3A–D). The downregulated genes included secretory cell markers of both goblet and enteroendocrine lineages (Figures S2A,B and S3A–C). Strikingly, gene set enrichment analysis (GSEA) 27,28 revealed a dramatic downregulation of genes encoding glycosylation enzymes in the DKO mice, as shown in the heatmap of differentially expressed genes (Figures 5A,B and S3 and Table S1). Next, we employed the GlycoMaple web tool29 (https://glycosmos.org/glycomaple/index), part of the GlyCosmos Portal30, to map these transcriptome changes to the various glycosylation pathways and to evaluate their expected effects on glycan structures in our mutant mice. The silenced glycosylation genes included those encoding the transferases catalyzing almost all steps in Mucin O-glycosylation, starting from the initial conjugation of N-acetylgalactosamine to the addition of the terminal fucosyl residue (Figures 5C and S4). Other FOXA-dependent glycosylation genes were associated with glycosphingolipid biosynthesis, and unlike O-glycosylation genes, are expressed also in the non-goblet cell epithelium (Figure S5 and Table S2). Many of these genes are directly controlled by the FOXA proteins, as evidenced by binding to either their promoters or enhancers (Figures 5D,E). Our single nuclei transcriptome data and RNA in situ hybridization also support their specific or higher expression in goblet cells in control compared to DKO mice (Figure 5F–H). These results suggest that the FOXA transcription factors regulate the mucin glycosylation program in the colonic epithelium and implicate that disruption of this program as the likely cause of dysbiosis and inflammation in DKO mice.
Figure 5: Mucin O-glycosylation is defective in FoxA-deficient colon.

(A) Heatmap of glycosylation genes expressed in colonic epithelium and their expression levels in control vs. DKO proximal colon by RNAseq. N=6 per group.
(B) GSEA plot of glycosylation genes in DKO vs. control proximal colon. Y axis titles; RES, Running Enrichment Score, RLM, Ranked List Metric. The list of glycosylation genes in (A) and (B) was taken from the GlycoGene Database (GGDB).
(C) Mucin-type O-glycosylation scheme with the main core glycans present in the colon. Genes that are downregulated in the DKO colon are highlighted in red. Asterisks indicate binding of FOXA1/2 to the gene as determined by ChIP-Seq.
(D) Venn diagram showing the overlap between FOXA1/2-bound genes, downregulated genes in DKO colon, and glycosylation genes.
(E) Genomic tracks of selected O-glycosylation genes, showing the binding of FOXA1 and FOXA2 and expression level in control and DKO proximal colon.
(F) UMAP plots of single nuclei transcriptome described in Figure S1, showing the expression of Muc2 and several glycosylation genes. The two goblet cell clusters are circled by a dashed line.
(G,H) RNA in situ hybridization of Fut2 (G) and Gcnt3 (H) in colonic sections from control and DKO mice (red), co-stained with the lectins UEA-I and WGA (green), E-cadherin (gray), and Dapi (blue).
(I,J) Glycan composition of colonic mucus from control (n=6) and DKO (n=5) mice. (I) shows core structures and (J) shows terminal structures. Mucus samples are from 4–5 month old mice. For all glycan structures, see Table S3.
(K) Representative staining of UEA-I (green) and MAL II (red) lectins, with Dapi (blue), in colonic sections from control and DKO mice.
(L) The mean of the area stained by UEA-I divided to the area stained by MAL II in each image. Images were analyzed from 3 mice per group.
In boxplots: center line, median; box, first and third quartiles; whiskers, 1.5× IQR with all samples, including outliers individually plotted. ***, p<0.001; ****, p<0.0001
To directly assess the impact of downregulation of glycosylation genes on mucus glycan composition, we performed quantitative glycomic analysis of mucins, predominantly MUC2, extracted from the colonic mucus of control and DKO mice (Table S3). The difference in glycan structures in FOXA deficient mice revealed by this analysis correlated closely with the gene expression changes of glycosylation genes documented above. Thus, Core 2-type O-glycans were significantly decreased in DKO mice (Figure 5I), reflecting the down regulation in the β-1,6-N-acetylglucosaminyltransferases Gcnt2 and Gcnt3. In addition, fucosylated structures were dramatically less abundant in the mucus of DKO mice (Figure 5J), consistent with the downregulation of the fucosyltransferase, Fut2. We hypothesize that the observed increases in sialylation and sulfation (Figure 5J) are secondary to the loss of fucosylation, since sialyltransferases and sulfotransferases are competing with FUT2 for the terminal Gal residues. Of note, core 3- and core 4-type O-glycan structures were not detected in our mice, as observed in other mouse studies and in contrast to human colonic glycan composition31. Staining with the fluorescent lectins Ulex Europaeus Agglutinin I (UEA-I) and Maackia Amurensis Lectin II (MAL II) for fucosylated and sialylated mucins, respectively, also confirmed the glycomics data, showing a decreased fucosylation to sialylation ratio in the DKO colonic epithelium (Figure 5K,L).
The DKO microbiome adjusts to the altered mucus environment
The altered glycans in DKO mice could play a central role in shifting gut microbial composition, since mucus glycans serve as a matrix of adherence and as a carbon source for gut microbes32,33. To support the relationship between the DKO host glycans and the microbiome changes observed by 16S sequencing we next analyzed microbial gene abundance. We performed shotgun sequencing of gut bacteria from control and DKO mice (Figure 6A) and discovered major differences between the two groups according to a principal component analysis of the Bray-Cursits distances (Figure 6B, p = 0.001 by PERMANOVA). Among the significantly changed metabolic pathways in the bacteria colonizing the DKO colon, those related to sugar and glycan metabolism were most prominent (Figures 6C,D). Galactose metabolism stands out among the top increased pathways, which is likely an adaptation of the microbiome to the increase in Core 1-type O-glycans with terminal galactose moieties in the DKO mucus. This, together with the downregulation of another N-acetylglucosaminyltransferase encoding gene, A4gnt, increases the terminal galactose residue ratio in the mucus of DKO mice and thus increases the fitness of galactose-metabolizing bacteria. Additional changes in the metagenome of DKO mice (Figures 6C,D) are likely linked to the higher levels of sulfation of DKO mucins (Figure 4G), as the sulfur metabolic pathway was increased among DKO gut bacteria (Figure 6C).
Figure 6: Metagenome adaptation to the altered colonic environment of the FOXA-deficient host.

(A) Samples used were from the 16S study in Figure 5. Only the last time point (82 days of housing separated by genotype) was examined by metagenomic analysis.
(B) Principal coordinate analysis (PCoA) of Bray-Curtis distances of KEGG ortholog abundances between samples. The percent variance of the data captured by each PCoA dimension is shown in the axes.
(C) FuncTree visualization of changes in KEGG terms and pathways. Increased abundance is represented in green and decreased abundance in purple. Circle size represents the FDR value. Tree is centered on metabolism. Sugar- and glycan-related pathways and modules are shown.
(D) Change in logit-transformed relative abundance of sugar- and glycan-related KEGG pathways in the DKO mice vs. controls. See methods for details.
(E) Heatmap of bacterial glycoside hydrolase abundance in control and DKO mice. Values presented were scaled to the mean and standard deviation of each gene (z-scores).
(F) Relative abundance of sugar- and glycan-related KEGG pathways in fecal bacteria cultured with mucus extracted from control or DKO mouse colon for 48 hours. *, p<0.05, ***, p<0.001.
When focusing on specific bacterial glycoside hydrolases, their pattern of abundance again had a striking relationship to the glycan availability (Figure 6E). Specifically, galactosidase and sialidase encoding genes were increased in abundance, corresponding to the high Core 1 glycans and terminal sialylation levels found in the mucous of DKO mice (Figures 6E and 4F,G). We also observed a shift towards polysaccharide metabolism from dietary sources, as the abundance of enzymes such as cellulase, pullulanase, chitosanase and others were increased in the DKO microbiome. In sum, the dramatic metagenomic changes in the DKO gut microbiome match the new host ecosystem, strongly suggesting a fundamental role of the altered mucus glycans as determinants of bacterial composition and metabolism.
To further substantiate the role of altered glycans as the driving force behind microbial changes, rather than other cellular factors, we cultured fecal bacteria from control mice with the addition of either control or DKO mucus. DKO mucus increased most of the bacterial pathways related to glycan and sugar metabolism found in cultured bacteria, in line with our in vivo observations (Figure 6D,F). In summary, while other factors within the DKO colon may contribute to the shift in the microbiome, the glycosylation defect stands out as a major determinant.
The DKO microbiome is determined by host genetics
Given the strong association between the DKO glycans and microbiome composition, we predicted that fecal transfer from DKO to wild-type mice would be followed by a rapid shift of the DKO microbiome to match the wild-type host glycans. To test our hypothesis of microbiome dependency on FoxA function, we transferred fecal material, processed under anaerobic conditions, from DKO and control mice to FoxA wild-type germ-free mice (Figure 7A). As soon as one week after the fecal transplant, the alpha diversity of the DKO-recipient microbiome increased dramatically and reached a similar level as that of the wild-type-donors or recipients of wild type fecal transplants three weeks after the transfer (p = 0.046, 0.036, and 0.0077 for richness, Shannon diversity index, and Faith’s phylogenetic diversity respectively, DKO-recipient vs. DKO donor, Figure 7B). In addition, the taxonomic distribution showed high similarity between the control and DKO microbiome after transfer into wild-type mice, with an increased ratio of the Bacteroidetes to Firmicutes phyla (p = 0.042, Figure 7C). Specifically, the most suppressed taxa in DKO mice, the Firmicutes family Lachnospiraceae and the Firmicutes order Clostridiales, repopulated the gut following the transfer to wild-type mice (FDR = 2.1E-3 and 1.8E-5 respectively). Conversely, dominant taxa in the DKO, such as Proteobacteria sutterella, were significantly reduced after transfer (FDR = 4.9E-4, Figure 7D). These results are reflected in the beta diversity of the analyzed samples. While DKO donors are well separated by UniFrac distances (p = 0.01 by Permanova), the DKO-recipient mice fall close to the wild-type donors and recipients (p = 0.11, Figure 7E). Notably, the distance between the control- and DKO-recipients trends downward, indicating the normalization of dysbiosis via the FoxA-competent wild type gut epithelium (p = 0.0725, Figure 7F).
Figure 7: Normalization of DKO microbiome following fecal transfer to gnotobiotic FoxA wild-type mice.

(A) Sample collection and transfer timeline. Control and DKO mice were separated according to their genotype seven days before stool collection. The samples were pooled for homogenization and administered to germ-free mice at day 0. 16S sequencing was performed on fecal samples from the donor mice and the recipients at day 7, 14, and 21 after transfer.
(B) Alpha diversity of gut bacteria in control and DKO donor (D) and recipient (R) mice, represented by observed OTUs (Richness), Shannon index, and Faith’s phylogenetic diversity (PD). The collection time point is indicated by the color scheme.
(C) Taxonomic abundance proportions in control and DKO donor and recipient mice. Data are represented by bacterial genera, families or orders (specified by the g_, f_, o_ prefix). Each column represents one sample (for recipients, time point is indicated by 1, 2, or 3) and each color represents one genus. Only the top 10 genera are included in the plot. The rest are lumped into “Other”.
(D) Relative abundance of specific taxa, represented for control and DKO donors and recipients as in B.
(E) Beta diversity of gut bacteria as shown by principal coordinates analysis (PCoA) of the weighted and unweighted UniFrac distances between all samples. The collection time point is indicated by the color scheme.
(F) Unweighted Unifrac distances between DKO-recipients and Control-recipients at each timepoint.
(G,H) Pathological scoring of inflammation (G) and isolated lymphoid follicles (H) in recipient mice 3 weeks after repeated fecal transfers from control or DKO mice (experiment described in Figure S6).
(I) mRNA expression level of Lcn2 and Tnf in colonic tissue from recipient mice as in (G). *, p<0.05.
Repeated transfer of the DKO microbiome induces mild colitis in wild type gnotobiotic mice
Since a single transfer of the DKO microbiome to wild type germ-free mice failed to establish dysbiosis, we could not employ this model to evaluate the effects of the DKO microbiome on the inflammatory phenotype. Instead, we conducted a fecal transfer experiment in which control and DKO feces were repeatedly transferred into wild type gnotobiotic mice every 2–3 days for 3 weeks (Figure S6A), to encourage at least minimal colonization. However, even the repetitive transfers did not yield sustained DKO bacterial colonization in wild type germ-free mice. The alpha diversity of the DKO bacteria increased and reached the wild type level 2 weeks after the first transfer (p = 0.0051, 0.058, and 0.79 for richness, Shannon diversity index, and Faith’s phylogenetic diversity respectively, DKO-recipient vs. DKO donor, Figure S6B). The taxonomic distributions of the control and DKO bacteria in the recipient mice were also highly similar (Figure S6C,D). Lastly, the beta diversity distribution showed that the microbiome of the DKO recipients fall much closer to the control recipients and donors than to the DKO donors (Figure S6E). Thus, the wild type host environment is dominant over repeated colonization by the DKO microbiome and quickly restores the bacterial communities back to its normal composition.
While even our repeated fecal transplants could not permanently alter the colonic microbiome of wild type mice, we surmised that the transient changes in microbiome composition induced by this paradigm might nevertheless be sufficient to trigger some aspects of inflammation. To test this hypothesis, we measured inflammation markers in the wild type recipient mice and found that indeed mild inflammation was present in a subset of the mice that had received fecal transplants from DKO donors. Pathological scoring for inflammation was significantly higher after repeated DKO bacterial transfer (Figure 7G), with trends for more isolated lymphoid follicles and a higher expression level of Lcn2 and Tnf in the colonic tissue (Figure 7H,I). These data support the notion that the dysbiosis in the DKO mice is contributing to the inflammatory phenotype in these mice, while also confirming that, long-term, the host epithelium has a major impact on the composition of the colonic microbiome.
Discussion
The evolutionary colonization of multicellular organisms likely coincided with the development of the first closed gut tube in primitive metazoan more than 600 million years ago, establishing a host-microbiome symbiont with a defined microbial community that differs from that of the ambient environment. The animal ‘holobiont’ thus comprises the animal host and its coevolved microbial communities34. The FoxA clade of winged helix transcription factors, which we have shown here to be critical determinants of gut microbiome composition, arose at least 600 million years ago, and orthologues have been described in cnidarians such as Hydra35 and the sea anemone, Nematostella vectensis36. Previously, analyses of gene expression profiles and mutant phenotypes have established critical roles of the FoxA clade in body axis formation. Thus, the FoxA genes are expressed in the organizing regions just prior to and during gastrulation in vertebrates37–39 and in the endoderm of Hydra during axis formation35. Gene ablation studies demonstrated that neural tube patterning is critically dependent on Foxa240,41, and that the differentiation of multiple endoderm-derived organs relies on FoxA factors acting as lineage-determining transcription factors4–7. It is tempting to speculate that another evolutionarily shared function between primitive metazoans and vertebrates is in the establishment of a specific gut luminal niche for settlement by commensal microbes beneficial to the host. Future experimentation in ‘primitive’ metazoans could address this hypothesis.
While we had previously shown that the FOXA1/2 proteins control the differentiation of specific enteroendocrine cell lineages and the maturation of goblet cells from progenitor cells7, we now discovered that these transcription factors regulate a whole bank of genes encoding glycosylation enzymes, which are critical to present the ‘right’ carbohydrate moieties to the intestinal flora. While overall mucin production and secretion was normal in FOXA deficient mice, the chemical composition of the glycoproteins was changed systematically, with a massive loss of fucosylation and Core 2 glycosyl groups, highlighting a fundamental role for FOXA1/2 as master regulators of the epithelial glycosylation process. As a consequence, the composition of the gut microbiota was changed dramatically, even in mice co-housed with wild type animals where they repeatedly share their gut microbiota through coprophagia. These findings clearly establish a dominant role for the host epithelium in determining a favorable microbiome. We suggest that this association between glycan composition and microbiota abundance needs to be considered when debating the efficacy of fecal transplants or probiotics as a treatment modality. Our findings suggest that the effects of such interventions are likely to be only temporary, as the microbiome will eventually return to the composition dictated by the host epithelium.
Glycosylation defects and dysbiosis were both reported in IBD patients42–44. Moreover, the severity of the disease has been correlated with the extent of glycosylation defects45, although a causative role was not established in these studies. In mouse models, increased susceptibility to experimentally induced colitis developed following Fut246 or Core 1 glycan47 deficiency. Alterations in mucous glycans could in principle contribute to IBD pathogenesis in several ways, including impaired barrier function, altered immunity, and imbalance of the host-microbiome symbiosis. In regard to the latter possibility, host glycans serve as ligands for bacterial adhesion and as nutrients for bacterial metabolism, and in a healthy state favor colonization of “good” bacteria. Our bacterial ablation experiment using a cocktail of six antibiotics strongly supports a primary role for the dysbiosis in the colitis phenotype in FOXA-deficient mice. Since we did not observe bacterial invasion into the inner mucus layer, we hypothesize that the dysbiosis in DKO mice leads to colitis through altered secreted metabolites or other signals. Thus, butyrate metabolism, which is associated with protection from IBD48–50, was decreased in our metagenomic analysis (Figure S7). Of note, we do not claim that the observations we made here on a mouse model of FOXA deficiency extend to human IBD, and no changes to FOXA1 or FOXA2 expression have been reported to date in human IBD specimens, possibly in part due to the great variability in these datasets.
We note that the antibiotic treatment of FOXA-deficient mice alleviated the colitis phenotype only partially and envision several explanations for this finding. Firstly, total ablation of the gut microbiota leads to a non-physiological state, in which not only detrimental taxa but also beneficial bacteria are missing from the gut lumen. Secondly, we do not rule out altered immunity as an additional player in the colitis phenotype, as bacterial antigens interact with epithelial glycans for proper uptake and initiation of the immune response51,52. Also, MUC2 glycans were shown to contribute to immune tolerance in the gastrointestinal tract53. Finally, the recruitment of leukocytes from blood vessels into the gut lumen is also facilitated by epithelial glycans54. Future studies will be directed at investigating the dependency of gut immunity on specific glycans in FOXA-deficient mice.
In sum, we have shown that the evolutionarily ancient winged helix transcription factors of the FOXA class are critical determinants of the gut microbiome through their control of a network of genes functioning in protein glycosylation. Without the presentation of a favorable glycocalyx on the colonic surface, dysbiosis ensues, which in turn causes colitis and significant impairment of animal health. We hope that future studies will take advantage of this model to further investigate the link between specific epithelial glycans and gut homeostasis.
Limitations of Study
This study highlights the relationship between aberrant mucus glycosylation and colitis using a genetically defined mouse model. Although prior genome-wide association and other human studies have suggested an association between glycosylation defects and IBD, a more comprehensive investigation is necessary to establish the mechanism. Currently, the complex and diverse genetic backgrounds and dietary and behavioral differences present in IBD patients obscure a clear understanding of the role of the glycosylation program as cause of the disease. In the current study, we controlled for environmental factors by ensuring all mice were exposed to identical conditions. Thus, all mice were fed a standard rodent chow diet throughout the experiments. Altering dietary conditions to simulate a ‘Western’ diet could potentially yield different results, shedding light on additional aspects related to the interrelationship among the microbiome, host glycans, and dietary glycans, representing a limitation of the current work. In addition, FOXA transcription factors play a central role in lineage differentiation in the intestine by regulating multiple downstream targets. While our study confirmed the causal link between glycosylation genes, the microbiome, and colitis, we cannot rule out the possibility that other FOXA targets, beyond glycosylation genes, may also be associated with changes in the microbiome or the inflammatory phenotype.
STAR methods
Resource availability
Lead contact
Further information and requests for resources and reagents should be directed to and will be fulfilled by the lead contact, Klaus H. Kaeastner (kaestner@pennmedicine.upenn.edu).
Materials availability
This study did not generate new unique reagents.
Data and code availability
The raw sequencing data published in this article can be found in the NCBI repository, accession number PRJNA1091956: https://www.ncbi.nlm.nih.gov/bioproject/PRJNA1091956. The processed data for the RNA-sequencing, ChIP-sequencing, and single-nuclei RNA-sequencing have been deposited at GEO with the accession numbers listed in the key resources table. Raw data from Figure S2 were deposited on Mendeley at http://dx.doi.org/DOI:10.17632/r2h76p84r4.1. Microscopy data reported in this paper will be shared by the lead contact upon request.
Key resources table.
| REAGENT or RESOURCE | SOURCE | IDENTIFIER |
|---|---|---|
| Antibodies | ||
| Mouse anti FOXA1 (IHC) | Millipore Sigma | 05-1466 |
| Rabbit anti FOXA2 (IHC) | Millipore Sigma | 07-633 |
| Mouse anti E-Cadherin | BD Biosciences | 610181 |
| Rabbit anti Epcam | Abcam | ab71916 |
| Rat anti CD45R | BD Biosciences | 550286 |
| Rabbit anti CD3 (SP7) | Novus Biologicals | NB600-1441 |
| Rat anti Ki67 | Invitrogen | 50-245-563 |
| Rabbit anti MUC2 (for immunostaining) | Santa Cruz | sc-15334 |
| Rabbit anti MUC2 (for western blot) | Abcam | ab272692 |
| Mouse anti Tubulin | Sigma | T9026 |
| Mouse anti FOXA1 (ChIP) | Abcam | ab23738 |
| Rabbit anti FOXA2 (ChIP) | Santa Cruz Biotechnology | sc-6554 |
| Rabbit anti CD45 (D3F8Q) | Cell Signaling | 70257 |
| Monoamine Oxidase A (MAO-A) | ||
| Cy2 AffiniPure Donkey Anti-Rabbit IgG | Jackson ImmunoResearch | 711-225-152 |
| Cy5 AffiniPure Donkey Anti-Mouse IgG | Jackson ImmunoResearch | 715-175-151 |
| Cy3 AffiniPure Donkey Anti-Rabbit IgG | Jackson ImmunoResearch | 711-165-152 |
| Cy5 AffiniPure Donkey Anti-Rabbit IgG | Jackson ImmunoResearch | 711-175-152 |
| Cy3 AffiniPure Donkey Anti-Mouse IgG | Jackson ImmunoResearch | 715-165-151 |
| Chemicals, peptides, and recombinant proteins | ||
| R-buffer A | Electron Microscopy Sciences | 62706-10 |
| Cas-block | Thermo Fisher Scientific | 008120 |
| Hoechst 33342 | Thermo Fisher Scientific | H3570 |
| HRP | Vector laboratories | PK-7100 |
| DAB substrate | Vector laboratories | SK-4100 |
| Ulex Europaeus Agglutinin I (UEA I), Fluorescein | Vector laboratories | FL-1061 |
| Maackia Amurensis Lectin II (MAL II), Cy3 | GlycoMatrix | 21511109-1 |
| Wheat Germ Agglutinin (WGA), Rhodamine | Vector laboratories | RL-1022 |
| Carbo-Free Blocking Solution | Vector laboratories | SP-5040-125 |
| TrueBlack® Lipofuscin Autofluorescence Quencher | Biotium | 23007 |
| ProLong™ Gold Antifade Mounting medium | Thermofischer | P36930 |
| FITC-dextran, 3–5 kDa | Sigma-Aldrich | FD4 |
| 5-ethynyl-2’-deoxyuridine (EdU) | Invitrogen | E10187 |
| TRIzol reagent | Invitrogen | 15596026 |
| T4 DNA polymerase | NEB | M0203 |
| Klenow DNA polymerase | NEB | M0210 |
| T4 polynucleotide kinase | NEB | M0201 |
| Klenow Fragment (3’→5’ exo-) | NEB | M0212 |
| Nuclei EZ Lysis Buffer | Sigma | NUC-101 |
| TAQMAN Fast Gene Expression Universal PCR Master Mix | Thermo Fisher Scientific | 4352042 |
| Q5 High-Fidelity DNA Polymerase | NEB | M0491 |
| Critical commercial assays | ||
| Lipocalin-2 DuoSet mouse ELISA kit | R&D systems | DY1857 |
| Click-iT™ EdU Cell Proliferation Kit for Imaging, Alexa Fluor™ 555 dye | Thermo Fisher Scientific | C10338 |
| RNeasy Micro Kit | Qiagen | 74004 |
| High-Capacity cDNA Reverse Transcription Kit | Applied Biosystems | 4374966 |
| Pierce™ BCA Protein Assay Kits | ThermoFisher | 23225 |
| Immobilon Crescendo Western HRP substrate | Millipore | WBLUR0100 |
| RNAscope® Multiplex Fluorescent Detection Reagents V2 | ACD | 323110 |
| HybEZ oven | ACD | PN 321710/321720 |
| RNAscope® Probe Diluent | ACD | 300041 |
| TSA Vivid fluorophore 650 | ACD | 323273 |
| TSA Vivid fluorophore 570 | ACD | 323272 |
| TSA Vivid fluorophore 520 | ACD | 323271 |
| NEBNext Ultra RNA Library Prep Kit for Illumina | NEB | E7530 |
| NEBNext Poly(A) mRNA Magnetic Isolation Module | NEB | E7490 |
| QIAquick PCR Purification Kit | Qiagen | 28104 |
| Chromium Next GEM Single Cell 3′ Reagent Kits v3.1 | 10X genomics | PN-1000121 PN-1000122 |
| DNeasy PowerSoil Pro kit | Qiagen | 47016 |
| Nextera XT DNA Library Preparation Kit | Illumina | FC-131-1096 |
| Deposited data | ||
| Glycan analysis MS raw files at GlycoPOST database: https://glycopost.glycosmos.org/preview/7094574161e18019e3f37 | This paper | GlycoPOST ID: GPST000248 password: 6868 |
| Micrbial 16S sequencing | This paper | PRJNA1091956 |
| Metagenomic sequencing | This paper | PRJNA1091956 |
| RNA sequencing of proximal and distal colon | This paper | PRJNA1091956 and GEO: GSE263630 |
| ChIP sequencing of FOXA1 and FOXA2 | This paper | PRJNA1091956 and GEO: GSE263629 |
| Single nuclei RNA sequencing of distal colon | This paper | PRJNA1091956 and GEO: GSE263631 |
| Unprocessed Western blots | This paper | Mendeley data: http://dx.doi.org/DOI:10.17632/r2h76p84r4.1 |
| Experimental models: Organisms/strains | ||
| Foxa1lox/lox mice | Kaestner lab, University of Pennsylvania | N.A. |
| Foxa2lox/lox mice | Kaestner lab, University of Pennsylvania | N.A. |
| Villin1-Cre mice | Jackson Laboratory | 033019 |
| Oligonucleotides | ||
| EUB338 FISH probe, Cy3-conjugated: 5′-GCTGCCTCCCGTAGGAGT-3′ | IDT | N.A. |
| Nonsense FISH probe, Cy3-conjugated: 5′-CGACGGAGGGCATCCTCA-3′ | IDT | N.A. |
| RNAscope™ Probe- Mm-Foxa2-C2 | ACD | 409111-C2 |
| RNAscope™ Probe- Mm-Muc2-C3 | ACD | 315451-C3 |
| RNAscope™ Probe- Mm-Gcnt3 | ACD | 553881 |
| RNAscope™ Probe- Mm-Fut2 | ACD | 811421 |
| 16s qPCR BSF8 primer: AGAGTTTGATCCTGGCTCAG | IDT | N.A. |
| 16s qPCR BSR357 primer: CTGCTGCCTYCCGTA | IDT | N.A. |
| 16s qPCR Taqman probe: /56-FAM/TAA +CA+C ATG +CA+A GT+C GA/3BHQ 1/ | IDT | N.A. |
| Lcn2 forward primer: CAATGTCACCTCCATCCTGG | IDT | N.A. |
| Lcn2 reverse primer: CCTGGAGCTTGGAACAAATG | IDT | N.A. |
| Tnf forward primer: ACTCCAGGCGGTGCCTATGT | IDT | N.A. |
| Tnf reverse primer: AGTGTGAGGGTCTGGGCCAT | IDT | N.A. |
| Actb forward primer: CACAGCTTCTTTGCAGCTCCT | IDT | N.A. |
| Actb reverse primer: GTCATCCATGGCGAACTGG | IDT | N.A. |
This paper does not report original code.
Any additional information required to reanalyze the data reported in this paper is available from the lead contact upon request.
Experimental model and study participant details
Mice
The mouse strains used in this study were Foxa1L/L, 4, Foxa2L/L, 9, and Villin1-Cre10. Foxa1L/L; Foxa2L/L mice were crossed with Villin1-Cre; Foxa1L/L; Foxa2L/wt to obtain Villin1-Cre; Foxa1L/L; Foxa2L/L (DKO) mice. Mice were housed in a constant twelve-hour light-dark cycles at 21°C. All mice received ad libitum water and standard rodent chow. For fecal transfer experiments, see details below. All procedures involving mice were conducted under a protocol approved by the Institutional Animal Care and Use Committee (IACUC) of the University of Pennsylvania.
Method details
Histology and pathological scoring
Paraffin sections (5μm-thick) were prepared from longitudinally cut, formalin-fixed, paraffin-embedded intestinal tissue. The H&E sections were evaluated by a board-certified veterinary pathologist and relevant lesions were scored in a semi-quantitative fashion similarly to a previously established scoring systems55,56. The evaluation was performed by the Comparative Pathology Core at the Penn Veterinary hospital.
Immunostaining
Slides were deparaffinized and rehydrated in decreasing ethanol concentrations. Antigen retrieval was performed in R-buffer A, pH 6 (Electron Microscopy Sciences, 62706–10) or with EDTA buffer pH 9 using a pressure cooker (2100 antigen retriever, Proteogenix). An incubation step with 3% hydrogen peroxide for 15 minutes was added for DAB-stained slides. Primary antibodies were diluted in Cas-block (Thermo Fisher Scientific, 008120) and applied for overnight incubation at 4°C. The following day, fluorescent secondary antibodies (Jackson ImmunoResearch) were added, diluted 1:300 in PBS containing 1% BSA, for 3 hours. Nuclear staining was performed with Hoechst 33342 (1:10,000, Thermo Fisher Scientific, H3570). For DAB staining, biotin-conjugated secondary antibodies (1:200 in Cas-block) were applied for 30 minutes, followed by 30 minutes incubation with HRP (Vector laboratories, PK-7100). The DAB substrate (Vector laboratories, SK-4100) was applied for 5 minutes or until color developed. Finally, hematoxylin was used for nuclear staining, followed by dehydration of the tissue and mounting. Immunofluorescence images were captured using a Leica TCS SP8 confocal microscope.
Lectin staining
Slides were processed as described for immunostaining. Fluorescently labeled UEA-I, MAL II, and WGA were added at 1:300 dilution for 2 hours in Carbo-Free Blocking Solution. When combined with immunostaining, antigen retrieval was performed, and lectins were added with the secondary antibodies.
EdU labeling and detection
Mice were I.P. injected with 150 μl of 10 mM EdU diluted in saline. 48 hours after injection, colon tissue was dissected and processed for histology. For EdU detection, slides were processed as described for immunostaining and Click-iT™ EdU Cell Proliferation Kit was used per manufacturer’s instruction. Primary and secondary antibodies followed the Click-iT reaction.
EdU and Ki67 quantification
Quantification of EdU- or Ki67-labeled nuclei in colonic crypts was performed by CellProfiler 4.2.6. Tiff images were used as the input, with the channels of DAPI, EdU or Ki67, and E-Cadherin, which all converted from color to gray before the analysis. Five colonic crypts were analyzed from each image. Each intact colonic crypt was identified as an ‘Object’. E-Cadherin was used to identify the edges of the crypt to ensure the exclusion of adjacent crypts and cells. After the identification of the crypts, the DAPI channel was used to identify the nuclei within a colonic crypt. Nuclei were considered primary objects, and the ground truth to which the EdU and Ki67 expressing cells were traced back to. Any EdU or Ki67 signal detected that cannot be traced back or superimposed on a nucleus was discarded, as well as any incomplete objects on the borders of the images analyzed. Finally, the ratio of EdU or Ki67 expressing cells to all cells in colonic crypts was calculated and compared across DKO and WT mice.
RNA-scope in situ hybridization
RNAscope was performed on FFPE-fixed, RNase free sections. Slides were incubated at 60°C for 1 hour followed by deparaffinization in Xylene and 100% Ethanol. After deparaffinization, slides were dried at 60°C for 5 minutes. Then, H2O2 was added for 10 minutes at RT, followed by 5 washes in distilled water. Target retrieval was performed in boiling 1X target retrieval solution (> 98 °C ) for ~15 minutes according to the manufacturer’s instructions. Slides were briefly rinsed with water and then transferred to 100% Ethanol for 3 minutes and dried at 60°C for 5 minutes. After ImmEdge hydrophobic pen was applied, slides were left to dry for another ~5 minutes at RT. Finally, slides were treated with Protease Plus for 30 minutes at 40°C.
mRNA probes were warmed for ~10 minutes at 40°C and allowed to cool down to RT, then added to the slides followed by a ~2 hour incubation at 40°C. Probes were diluted at 1:50 in RNAscope probe diluent. Following the probe hybridization, slides were washed twice for 2 minutes in 1X RNAscope wash buffer. Finally, slides were stored in 5X SSC buffer overnight. In the next day, slides were washed twice for 2 minutes in 1X RNAscope wash buffer, then AMP1 was hybridized for 30 minutes, followed by 2 washes for 2 minutes. AMP2 was hybridized under similar conditions, and finally, AMP3 was hybridized for 15 minutes followed by 2 washes for 2 minutes. For Mm-Gcnt3 mRNA and Mm-Fut2 mRNA C1 probes, HRP-C1 signal was developed by incubating in HRP-C1 reagent for 15 minutes, followed by 2 washes for 2 minutes, a ~30 minute incubation in TSA Vivid 650, 2 washes, then an incubation in HRP blocker for 15 minutes. For Mm-FoxA2 C2 mRNA and Mm-Muc2 C3 mRNA, HRP-C2 and HRP-C3 signals were developed with TSA Vivid 650, and TSA Vivid 520, respectively.
For the combined immunofluorescence staining protocol, slides were washed twice for 2 minutes with 1X RNAscope wash buffer. Then, slides were washed 3 times in PBST for 5 minutes, followed by 3 additional washes in PBS and then incubated in Blocking buffer (CAS-Block) for ~1 hour at RT in a humidified chamber, and later incubated in mouse E-Cadherin at 1:200 dilution in CAS-Block overnight at 4°C. Following the primary antibody incubation, slides were washed 3 times for 5 minutes in PBST, followed by 3 additional washes in PBS. To quench autofluorescence, Trueblack quenching reagent was added for ~30 seconds, followed by 3 additional washes in PBS. The secondary antibodies were all diluted in PBS-1% BSA at 1:300 followed by a ~2 hour incubation in a humidified chamber at RT. Finally, slides were washed 3 times in PBS, incubated in the DAPI reagent included in the RNAscope® Multiplex Fluorescent Detection Reagents kit for ~30 seconds. An additional 5 minute wash in PBS was performed, and slides were mounted using ProLong™ Gold Antifade Mounting medium.
All images were acquired using a STELLARIS 5 Confocal Microscope. Images were taken at 63x magnification with immersion oil.
Western blot analysis
Colonic tissue (0.5 cm) was homogenized in RIPA buffer and protein content was determined using BCA assay kit. Proteins were separated by SDS-PAGE and immunoblotted with anti MUC2 and anti-Tubulin antibodies. HRP conjugated antibodies were incubated for 2 h at room temperature. HRP substrate was used to visualize blots with a Chemi-doc Touch Imaging system (Bio-Rad).
LCN-2 ELISA
Fecal samples were collected and stored at −80°C until processed. Each sample was reconstituted in PBS containing 0.1% Tween (100 mg/ml) and vortexed for 20 minutes to obtain a homogenous suspension, followed by 10 minutes centrifugation (12,000 rpm at 4°C). LCN-2 levels were measured in 1:100 diluted samples by using the DuoSet mouse ELISA kit (R&D systems, DY1857). All steps were carried out according to the manufacturer’s instructions.
Fluorescent in situ hybridization for bacterial DNA
The FISH procedure was performed as described57. Briefly, colon tissue was fixed in Carnoy solution (60% dry methanol, 30% chloroform, 10% acetic acid) to preserve luminal content and then embedded in paraffin. For staining, slides were deparaffinized in xylene and washed with 100% ethanol. Hybridization was performed with 1 μg of the Cy3-conjugated bacterial 16S probe EUB338 or a nonsense control probe overnight at 50°C. Primary antibodies against MUC2 (1:200) and E-cadherin (1:300) were added the following day. From this point, our standard immunostaining protocol was followed as described above.
FITC-dextran permeability test
FITC-dextran (3–5 kDa; Sigma-Aldrich FD4) was administered to mice by gavage (150 μl of 80 mg/ml in PBS). Blood was collected from the tail vein into heparin tubes 4 hours later. 15% v/v acid-citrate-dextrose solution was added as an anticoagulant, followed by centrifugation at 5,000 rpm for 10 minutes to obtain plasma. For FITC level detection, plasma samples were diluted 1:4 in PBS, transferred to Opaque black flat-bottom 96-well plates, and fluorescence measured at 530 nm with excitation at 485 nm using a BioTek Synergy H1 plate reader.
RNA sequencing and analysis
Colon tissues from 8–13 months old mice were cut longitudinally and washed thoroughly in cold PBS. RNA was extracted from 1 cm segments of both proximal and distal colonic tissues using TRIzol reagent (Invitrogen, 15596026) and RNeasy Micro Kit (Qiagen, 74004). Libraries were made with the NEBNext Ultra RNA Library Prep Kit for Illumina (NEB, E7530), using the Poly(A) mRNA Magnetic Isolation Module (NEB, E7490). Proximal colon libraries were paired-end sequenced to 100 bp on an Illumina NovaSeq, with a total read count of ~100,000,000 per sample. Distal colon libraries were single-end sequenced to 100 bp on Illumina HiSeq4000, with total read counts of ~50,000,000 per sample. Mapping to the genome was performed using Kallisto pseudo-alignment58 with the GRCm38 genome index. Mapped reads were filtered using the Base R package (reads count per million > 1) and normalized using calcNormFactors function from the edgeR package. Normalization method used was “TMM”. Hierarchical clustering and principal component analysis were performed to identify outliers using the Stats R package. Differentially expressed genes were obtained using the Limma package and the Voom function. Dplyr and ggplot2 R packages were used for data manipulation and visualization, respectively.
Gene set enrichment analysis was performed using the GSEA function from clusterProfiler R package, together with GSEABase and msigdbr packages. GSEA plots were created with the gseaplot2 function from enrichplot R package.
ChIP sequencing
The Chip-seq procedure was adapted from our previously published protocol4. Briefly, isolated colonic crypts from four wild type 3 months old C57BL/6 male mice were cross-linked in 1% paraformaldehyde for 15 minutes, followed by 5 minutes of quenching with 0.125 M glycine. Samples were washed with PBS and homogenized in cold whole-cell lysis buffer (10 mM Tris-HCl at pH 8.0, 10 mM NaCl, 3 mM MgCl2, 1% NP-40, 0.1% SDS, 0.5% deoxycholic acid) supplemented with protease inhibitors. After 10 min of incubation on ice, lysates were sonicated using a Diagenode Bioruptor (30-sec on/off pulses for 10 min on the high setting). Debris was removed by centrifugation at 13,000g for 10 min, and the supernatant was collected. DNA was reverse cross-linked and purified from the sonicated chromatin as input DNA. Immunoprecipitations were performed using 10μg of chromatin and 2μg of anti-rabbit FOXA1 antibody (ab23738; Abcam) or 2μg FOXA2 antibody (sc-6554; Santa Cruz Biotechnology), following a protocol described in detail elsewhere59.
The libraries were prepared with the NEBnext kit for Illumina. Briefly, DNA samples were blunted with a combination of T4 DNA polymerase, Klenow polymerase, and T4 polynucleotide kinase, then a single 3′-end “A” base was added using the Klenow exo (3′-to-5′ exo minus) enzyme. Adapters provided by Illumina were then ligated to the ends of the modified DNA before size selection of ~200-bp fragments via PAGE extraction. The isolated DNA samples were used as the template for amplification by 18 cycles of PCR. Amplified products were column purified with the QIAquick PCR Purification Kit (Qiagen) and assayed for quantity and quality with an Agilent 2100 Bioanalyzer (Agilent Technologies). Libraries were single-end sequenced to 50 bp on Illumina HiSeq2500, and reads were aligned to mm9 mouse genome.
The Homer software package60 in ‘factor mode’ was used to call FOXA1 and FOXA2 peaks. Peaks were selected at a false discovery rate (FDR) of 1%, cumulative Poisson p-value of 0.0001, and at least 4-fold greater coverage of reads in the ChIP sample compared with the background input reads. A union set of FOXA1 and FOXA2 peaks was constructed using Bioconductor software’s DiffBind package61. Regions that were called in at least two of the eight ChIP samples were selected into the union set. Genes associated with peaks were identified using GREAT (version 3.0.062). Motif enrichment analysis was performed on the union set of FOXA1/A2-bound chromatin regions, using Homer with default settings.
Single nuclei RNA sequencing
Colon tissues from two control mice were opened longitudinally and washed thoroughly from luminal content. 1 cm segments were flash frozen and stored in −80°C until processed. For nuclei extraction, the frozen tissues were minced and Dounce homogenized in 7 ml Nuclei EZ Lysis Buffer (Sigma, NUC-101), using a glass Dounce tissue grinder. Tissues were Dounce-homogenized 25 times using a loose-fitting pestle. Following 20 minutes of incubation on ice, the 25-times Dounce-homogenization step was repeated with a tight-fitting pestle. Samples were centrifuged at 400g and washed with lysis buffer to remove cytoplasmic contamination and debris. After two washing steps, nuclei were transferred into PBS containing 1% BSA and diluted to 1,000 nuclei/μl for 10X library preparations targeting 10,000 nuclei.
Libraries were made with Chromium Next GEM Single Cell 3ʹ Reagent Kits v3.1 (10X genomics, PN-1000121, PN-1000122), and sequenced on an Illumina HiSeq4000 for a total count of ~2×10⁸ reads per sample. Raw reads were processed and aligned by Cell Ranger, using “pre-mRNA” reference package to capture unspliced pre-mRNA. SoupX63 was first used on a list of abundant and lineage-specific genes (‘Muc2’, ‘Zg16’, ‘Fcgbp’, ‘Spink4’, ‘Tnfaip8’, ‘Spdef’, ‘Atoh1’, ‘Clca1’, ‘Bcas1’) to estimate cell free mRNA contamination and adjust read counts accordingly. Then, cells of low quality were removed based on two metrics: the UMI and mitochondria percentage. For the former, UMIs were removed to within 90% of the confidence interval (i.e. cells with the top 5% and bottom 5% of total RNA counts were excluded). For the later, cells with >= X% mito (X being the median+3.0*IQR of mito %) were removed. Then, doublets were removed by using DoubletFinder (default parameters and optimal pK estimated using the strategy described in the manual book). Finally, the two libraries were integrated to generate UMAP/tSNE using the Seurat package. Markers of each cluster were identified, and annotation was made based on known cell type marker genes64–66. Epithelial clusters were selected for downstream analysis.
Quantitative Real time PCR
RNA was extracted from 0.5 cm of the distal colon, as described for RNA sequencing. cDNA was made from 1 μg RNA using the High-Capacity cDNA Reverse Transcription Kit, according to the manufacturer’s instructions. Quantitative real-time PCR (qRT-PCR) was performed on a CFX96 Real-Time System (Bio-Rad) with PerfeCTa SYBR Green SuperMix (Quanta Biosciences).
Glycan analysis
Colon tissue was cut longitudinally and washed thoroughly of luminal content with ice cold PBS. The tissue was dried gently and placed on a hard plastic surface with the luminal side facing up. The mucosa was scraped off with a metal spatula and collected into an Eppendorf tube. All samples were frozen in −80°C for 2 hours and dried by overnight lyophilization.
Mucin proteins, predominantly MUC2, were extracted by adding 200 μl of guanidine hydrochloride extraction buffer (6 M GuHCl, 5 mM EDTA, 0.01 M NaH2PO4, adjusted to pH 6.5) to dried samples, followed by overnight hydration at 4°C. Samples were homogenized using a plastic pestle and centrifuged at 16,100g for 30 minutes at 4°C. Floating fat and supernatant were removed. The extraction step was repeated one more time with a shorter incubation time of 2 hours. Solubilization of MUC2 was achieved by reducing the disulfide bonds with dithiotreitol (DTT). 500 μl of solubilization buffer (6 M GuHCl, 0.1 M Tris, 5 mM EDTA, adjusted to pH 8.0, with 25 mM DTT added before use) was added to the pellets, followed by 5 hours incubation at 37°C. Then, the alkylation reagent iodoacetamide (62.5 mM) was added and samples were kept overnight in the dark at room temperature. After solubilization, samples were centrifuged at 16,100g for 5 minutes at 4°C to remove remnants.
To release O-linked glycans, 30 μl of soluble mouse MUC2 were dot-blotted to PVDF membrane (Millipore). The membrane was stained with Alcian blue (Sigma-Aldrich, 0.125% alcian blue in 25% ethanol and 10% acetic acid) for about 30 min and de-stained with methanol for 20 min (2 times). The dots were excised and transferred to a microcentrifuge tube. O-glycans were released by reductive β-elimination. 5 μl methanol was added to each tube, followed by a brief centrifugation. 40 μL of β-elimination solution (0.5 M NaBH4 and 50 mM NaOH) was then added to each well and samples were covered and incubated overnight at 50°C. The following day, 2 μl acetic acid was added to each tube. The samples were desalted using cation exchange resin packed into a C18 ZipTip (Millipore) 67.
Released glycans were resuspended in water and analyzed by liquid chromatography-electrospray ionization tandem mass spectrometry (LC-ESI/MS). The oligosaccharides were separated on a column (10 cm × 250 μm) packed in-house with 5 μm porous graphite particles (Hypercarb, Thermo-Hypersil, Runcorn, UK). The oligosaccharides were injected on to the column and eluted with an acetonitrile gradient (Buffer A, 10 mM ammonium bicarbonate; Buffer B, 10 mM ammonium bicarbonate in 80% acetonitrile). The gradient (0–45% Buffer B) was eluted for 46 min, followed by a wash step with 100% Buffer B, and equilibrated with Buffer A in next 24 min. A 40 cm × 50 μm i.d. fused silica capillary was used as a transfer line to the ion source. The samples were analyzed in negative ion mode on a LTQ linear ion trap mass spectrometer (Thermo Electron, San José, CA), with an IonMax standard ESI source equipped with a stainless steel needle kept at –3.5 kV. Compressed air was used as nebulizer gas. The heated capillary was kept at 270°C, and the capillary voltage was –50 kV. Full scan (m/z 380–2000, two microscan, maximum 100 ms, target value of 30,000) was performed, followed by data-dependent MS2 scans (two microscans, maximum 100 ms, target value of 10,000) with normalized collision energy of 35%, isolation window of 2.5 units, activation q0.25 and activation time 30 ms). The threshold for MS2 was set to 300 counts. Data acquisition and processing were conducted with Xcalibur software (Version 2.0.7). The LC-MS/MS data was processed using Progenesis QI (Nonlinear Dynamics, Waters). The MS raw files have been deposited in the GlycoPOST database under the ID of GPST000248 (https://glycopost.glycosmos.org/preview/7094574161e18019e3f37, password: 6868).
Microbiome 16S sequencing
DNA was extracted from stool using the Qiagen DNeasy PowerSoil kit. Extracted DNA was quantified with the Quant-iT PicoGreen Assay Kit. Barcoded PCR primers annealing to the V1-V2 region of the 16S rRNA gene was used for library generation. PCR reactions were carried out in duplicate (high volume studies) or quadruplicate using Q5 High-Fidelity DNA Polymerase (NEB, Ipswich, MA). Each PCR reaction contains 0.5 μM of each primer, 0.34 U Q5 Pol, 1X Buffer, 0.2 mM dNTPs, and 2.5 μl (high biomass samples) or 5.0 μl (low biomass samples) DNA in a total volume of 25 μl. Cycling conditions are as follows: 1 cycle of 98C for 1 m; 20 or 25 cycles of 98C for 10 s, 56 C for 20 S, and 72C for 20 sec; 1 cycle of 72C for 8 m. After amplification, quadruplicate PCR reactions were pooled and then purified using a 1:1 volume of SPRI beads. DNA in each sample was then quantified using PicoGreen and pooled in equal molar amounts. The resulting library was sequenced on the Illumina MiSeq platform using 2×250 bp chemistry. Extraction blanks and DNA free water were subjected to the same amplification and purification procedure to allow for empirical assessment of environmental and reagent contamination. Positive controls, consisting of eight artificial 16S gene fragments synthesized in gene blocks and combined in known abundances, were also included.
Sequence data were processed using QIIME268. Read pairs were processed to identify amplicon sequence variants with DADA269. Taxonomic assignments were generated by comparison to the Greengenes reference database70, using the naive Bayes classifier implemented in scikit-bio71. A phylogenetic tree was inferred from the sequence data using MAFFT72. Similarity between samples was assessed by weighted and unweighted UniFrac distance73,74, as well as percent shared species (Jaccard index) and Bray-Curtis distance.
Data files from QIIME were analyzed in the R environment for statistical computing, using the QIIMER library (http://cran.r-project.org/web/packages/qiimer). Global differences in bacterial community composition were visualized using Principal Coordinates Analysis. Community-level differences between sample groups were assessed using the PERMANOVA test, which allows sample-sample distances to be applied to an ANOVA-like framework75.
Metagenomics
Shotgun libraries were generated from fecal DNA using the NexteraXT kit and sequenced on the Illumina HiSeq 2500 using 2×125 bp chemistry. Extraction blanks and DNA free water were included to empirically assess environmental and reagent contamination. Laboratory-generated mock communities consisting of DNA from Vibrio campbellii and Lambda phage were included as positive sequencing controls.
Shotgun metagenomic data were analyzed using Sunbeam, a user-extendable bioinformatics pipeline developed for this purpose76. Quality control steps were performed by the default workflows in Sunbeam, which are optimized to remove host-derived sequences and reads of low sequence complexity. Reads were mapped to the KEGG database77 using Diamond78 to estimate the abundance of bacterial gene orthologs, as well as to curated databases of genes involved in butyrate production, polysaccharide utilization, and secondary bile acid production. Sample similarity was assessed by Bray-Curtis and Jaccard distances, and community-level differences between sample groups were assessed using the PERMANOVA test, where the logit-transformation follows the equation: logit = log(x / 1 − x) with x being the relative abundance for a given taxa. The FuncTree web tool (https://bioviz.tokyo/functree/) was used for visualization of differences in gene abundance79.
16S qPCR
DNA was extracted from stool using the Qiagen DNeasy PowerSoil Pro kit. DNA was diluted 1:100 with water and TaqMan-based qPCR amplification for 16S ribosomal RNA gene was applied. The primers and probe (see the resource table for sequences) were mixed with TaqMan Fast Universal PCR Master Mix (applied biosystems, 4352042) for final concentration of 0.4 μM and 80 nM, respectively. 5 μl of diluted DNA was used for each reaction. Real time PCR was performed using a QuantStudio6 qPCR Machine, with cycling conditions of 20 s at 95°C followed by 40 cycles of 3 s at 95°C and 30 s at 60°C. Signal was collected during the elongation step (at 60°C). 16S copy number per μl DNA was calculated by including 16S standard TOPO plasmid.
Fecal transfer to germ-free mice
Fecal samples were collected from donor mice and placed into liquid nitrogen, then stored at −80°C. Right before transplantation, the fecal pellets were pooled-homogenized in cold PBS (200μl/pellet) in an anaerobic chamber. Germ-free mice were transferred from isolators to iso-cages at the day of transplantation. Each received 200μl of the fecal homogenate by oral gavage. The recipient mice were maintained in iso-cages throughout the study.
In vitro culture of fecal bacteria
Fecal samples were processed as described above and used immediately. Mucus was prepared as described for the glycan analysis and kept lyophilized at −80°C. At the day of the experiment, the mucus samples were placed under UV for two hours to eliminate resident microbes. Homogenized feces were diluted in minimal medium as previously described80 with low glucose (0.5%). The mucus was resuspended for a final concentration of 1%(W/V). The experiment was performed in 96 well plate in a volume of 1 ml per well in anaerobic conditions. After 48 hours of incubation, DNA was extracted and libraries were made as described for the metagenomics study above.
Quantification and statistical analysis
Statistical analyses were performed using an unpaired 2-tailed Student’s t test. Data are presented as mean ± SD, using R software, unless otherwise indicated in the figure legends. *, p<0.05, **, p<0.01, ***, p<0.001, ****, p<0.0001. Number of samples or animals used in each experiment is indicated either in the figures themselves or in the legends. Linear mixed-effects models were used to detect differences in logit-transformed gene or taxa abundances between sample groups. P-values from multiple testing procedures were corrected to control for a false discovery rate of 0.05. Details of statistical tests regarding high throughput sequencing data are in the method details sections.
Supplementary Material
Highlights.
Deletion of FOXA1 and FOXA2 from the mouse intestinal epithelium causes colitis.
FOXA transcription factors control the glycan profile of the gut mucus.
The gut microbiome shifts in response to glycan changes in FOXA deficient mice.
Colitis in FOXA-deficient mice is attributed to the altered microbiome.
Acknowledgments:
We like to thank Drs. Eugene Change and Yuval Dor for critical reading of the manuscript, and members of the Kaestner lab for valuable scientific input. We thank the Center for Molecular Studies in Digestive and Liver Diseases (P30 DK050306) for the use of the Molecular Pathology and Imaging Core (MPIC) for tissue processing and the Host Microbial Analytic and Repository Core (H-MARC) for high-throughput sequencing. We thank the Cell & Developmental Biology Microscopy Core for the use of their confocal imaging services. We thank The CHOP Microbiome Center for the use of the high throughput sequencing core and the analytical core. We thank the Comparative Pathology Core at Penn’s veterinary hospital for pathological evaluation. We thank the Penn Gnotobiotic Mouse core for consultation and help with the fecal transfer experiment. We thank Dr. Yemin Lan from the Penn Epigenetics Institute for her help with the single cell sequencing analysis. This work was supported by NIH grants R37DK053839 and R01139049 to KHK.
Footnotes
Declaration of interests
The authors declare no competing interests.
Supplemental information
Document S1. Figures S1–S7
Table S1: Differential expression of glycosylation genes taken from the GlycoPortal database in DKO proximal and distal colon, related to Figure 5.
Table S2: Legends to glycosylation steps for GlycoMaple diagrams presented in Figure S4 and Figure S5, related to Figure 5.
Table S3: Glycan structure data obtained from control and DKO released mucins by LC-MS/MS, related to Figure 5.
Publisher's Disclaimer: This is a PDF file of an unedited manuscript that has been accepted for publication. As a service to our customers we are providing this early version of the manuscript. The manuscript will undergo copyediting, typesetting, and review of the resulting proof before it is published in its final form. Please note that during the production process errors may be discovered which could affect the content, and all legal disclaimers that apply to the journal pertain.
References
- 1.Gomaa EZ (2020). Human gut microbiota/microbiome in health and diseases: a review. Antonie Van Leeuwenhoek 113, 2019–2040. 10.1007/s10482-020-01474-7. [DOI] [PubMed] [Google Scholar]
- 2.Samochowiec J, and Misiak B (2021). Gut microbiota and microbiome in schizophrenia. Curr Opin Psychiatry 34, 503–507. 10.1097/YCO.0000000000000733. [DOI] [PubMed] [Google Scholar]
- 3.Troseid M, Andersen GO, Broch K, and Hov JR (2020). The gut microbiome in coronary artery disease and heart failure: Current knowledge and future directions. EBioMedicine 52, 102649. 10.1016/j.ebiom.2020.102649. [DOI] [PMC free article] [PubMed] [Google Scholar]
- 4.Gao N, LeLay J, Vatamaniuk MZ, Rieck S, Friedman JR, and Kaestner KH (2008). Dynamic regulation of Pdx1 enhancers by Foxa1 and Foxa2 is essential for pancreas development. Genes Dev 22, 3435–3448. 10.1101/gad.1752608. [DOI] [PMC free article] [PubMed] [Google Scholar]
- 5.Lee CS, Friedman JR, Fulmer JT, and Kaestner KH (2005). The initiation of liver development is dependent on Foxa transcription factors. Nature 435, 944–947. 10.1038/nature03649. [DOI] [PubMed] [Google Scholar]
- 6.Lee CS, Sund NJ, Behr R, Herrera PL, and Kaestner KH (2005). Foxa2 is required for the differentiation of pancreatic alpha-cells. Dev Biol 278, 484–495. 10.1016/j.ydbio.2004.10.012. [DOI] [PubMed] [Google Scholar]
- 7.Reizel Y, Morgan A, Gao L, Schug J, Mukherjee S, Garcia MF, Donahue G, Baur JA, Zaret KS, and Kaestner KH (2021). FoxA-dependent demethylation of DNA initiates epigenetic memory of cellular identity. Dev Cell 56, 602–612 e604. 10.1016/j.devcel.2021.02.005. [DOI] [PMC free article] [PubMed] [Google Scholar]
- 8.Ye DZ, and Kaestner KH (2009). Foxa1 and Foxa2 control the differentiation of goblet and enteroendocrine L- and D-cells in mice. Gastroenterology 137, 2052–2062. 10.1053/j.gastro.2009.08.059. [DOI] [PMC free article] [PubMed] [Google Scholar]
- 9.Sund NJ, Ang SL, Sackett SD, Shen W, Daigle N, Magnuson MA, and Kaestner KH (2000). Hepatocyte nuclear factor 3beta (Foxa2) is dispensable for maintaining the differentiated state of the adult hepatocyte. Mol Cell Biol 20, 5175–5183. 10.1128/MCB.20.14.5175-5183.2000. [DOI] [PMC free article] [PubMed] [Google Scholar]
- 10.el Marjou F, Janssen KP, Chang BH, Li M, Hindie V, Chan L, Louvard D, Chambon P, Metzger D, and Robine S (2004). Tissue-specific and inducible Cre-mediated recombination in the gut epithelium. Genesis 39, 186–193. 10.1002/gene.20042. [DOI] [PubMed] [Google Scholar]
- 11.Nielsen OH, Gionchetti P, Ainsworth M, Vainer B, Campieri M, Borregaard N, and Kjeldsen L (1999). Rectal dialysate and fecal concentrations of neutrophil gelatinase-associated lipocalin, interleukin-8, and tumor necrosis factor-alpha in ulcerative colitis. Am J Gastroenterol 94, 2923–2928. 10.1111/j.1572-0241.1999.01439.x. [DOI] [PubMed] [Google Scholar]
- 12.Chassaing B, Srinivasan G, Delgado MA, Young AN, Gewirtz AT, and Vijay-Kumar M (2012). Fecal lipocalin 2, a sensitive and broadly dynamic non-invasive biomarker for intestinal inflammation. PLoS One 7, e44328. 10.1371/journal.pone.0044328. [DOI] [PMC free article] [PubMed] [Google Scholar]
- 13.Dolan KT, and Chang EB (2017). Diet, gut microbes, and the pathogenesis of inflammatory bowel diseases. Mol Nutr Food Res 61. 10.1002/mnfr.201600129. [DOI] [PMC free article] [PubMed] [Google Scholar]
- 14.Madsen KL, Doyle JS, Tavernini MM, Jewell LD, Rennie RP, and Fedorak RN (2000). Antibiotic therapy attenuates colitis in interleukin 10 gene-deficient mice. Gastroenterology 118, 1094–1105. 10.1016/s0016-5085(00)70362-3. [DOI] [PubMed] [Google Scholar]
- 15.Sartor RB (2004). Therapeutic manipulation of the enteric microflora in inflammatory bowel diseases: antibiotics, probiotics, and prebiotics. Gastroenterology 126, 1620–1633. 10.1053/j.gastro.2004.03.024. [DOI] [PubMed] [Google Scholar]
- 16.Seksik P, Sokol H, Lepage P, Vasquez N, Manichanh C, Mangin I, Pochart P, Dore J, and Marteau P (2006). Review article: the role of bacteria in onset and perpetuation of inflammatory bowel disease. Aliment Pharmacol Ther 24 Suppl 3, 11–18. 10.1111/j.1365-2036.2006.03053.x. [DOI] [PubMed] [Google Scholar]
- 17.Videla S, Vilaseca J, Guarner F, Salas A, Treserra F, Crespo E, Antolin M, and Malagelada JR (1994). Role of intestinal microflora in chronic inflammation and ulceration of the rat colon. Gut 35, 1090–1097. 10.1136/gut.35.8.1090. [DOI] [PMC free article] [PubMed] [Google Scholar]
- 18.Sartor RB (2008). Microbial influences in inflammatory bowel diseases. Gastroenterology 134, 577–594. 10.1053/j.gastro.2007.11.059. [DOI] [PubMed] [Google Scholar]
- 19.Desai MS, Seekatz AM, Koropatkin NM, Kamada N, Hickey CA, Wolter M, Pudlo NA, Kitamoto S, Terrapon N, Muller A, et al. (2016). A Dietary Fiber-Deprived Gut Microbiota Degrades the Colonic Mucus Barrier and Enhances Pathogen Susceptibility. Cell 167, 1339–1353 e1321. 10.1016/j.cell.2016.10.043. [DOI] [PMC free article] [PubMed] [Google Scholar]
- 20.Martens EC, Lowe EC, Chiang H, Pudlo NA, Wu M, McNulty NP, Abbott DW, Henrissat B, Gilbert HJ, Bolam DN, and Gordon JI (2011). Recognition and degradation of plant cell wall polysaccharides by two human gut symbionts. PLoS Biol 9, e1001221. 10.1371/journal.pbio.1001221. [DOI] [PMC free article] [PubMed] [Google Scholar]
- 21.Salyers AA, Vercellotti JR, West SE, and Wilkins TD (1977). Fermentation of mucin and plant polysaccharides by strains of Bacteroides from the human colon. Appl Environ Microbiol 33, 319–322. 10.1128/aem.33.2.319-322.1977. [DOI] [PMC free article] [PubMed] [Google Scholar]
- 22.Sonnenburg JL, Xu J, Leip DD, Chen CH, Westover BP, Weatherford J, Buhler JD, and Gordon JI (2005). Glycan foraging in vivo by an intestine-adapted bacterial symbiont. Science 307, 1955–1959. 10.1126/science.1109051. [DOI] [PubMed] [Google Scholar]
- 23.Matsuoka K, and Kanai T (2015). The gut microbiota and inflammatory bowel disease. Semin Immunopathol 37, 47–55. 10.1007/s00281-014-0454-4. [DOI] [PMC free article] [PubMed] [Google Scholar]
- 24.Morgan XC, Tickle TL, Sokol H, Gevers D, Devaney KL, Ward DV, Reyes JA, Shah SA, LeLeiko N, Snapper SB, et al. (2012). Dysfunction of the intestinal microbiome in inflammatory bowel disease and treatment. Genome Biol 13, R79. 10.1186/gb-2012-13-9-r79. [DOI] [PMC free article] [PubMed] [Google Scholar]
- 25.Shin NR, Whon TW, and Bae JW (2015). Proteobacteria: microbial signature of dysbiosis in gut microbiota. Trends Biotechnol 33, 496–503. 10.1016/j.tibtech.2015.06.011. [DOI] [PubMed] [Google Scholar]
- 26.Amos GCA, Sergaki C, Logan A, Iriarte R, Bannaga A, Chandrapalan S, Wellington EMH, Rijpkema S, and Arasaradnam RP (2021). Exploring how microbiome signatures change across inflammatory bowel disease conditions and disease locations. Sci Rep 11, 18699. 10.1038/s41598-021-96942-z. [DOI] [PMC free article] [PubMed] [Google Scholar]
- 27.Mootha VK, Lindgren CM, Eriksson KF, Subramanian A, Sihag S, Lehar J, Puigserver P, Carlsson E, Ridderstrale M, Laurila E, et al. (2003). PGC-1alpha-responsive genes involved in oxidative phosphorylation are coordinately downregulated in human diabetes. Nat Genet 34, 267–273. 10.1038/ng1180. [DOI] [PubMed] [Google Scholar]
- 28.Subramanian A, Tamayo P, Mootha VK, Mukherjee S, Ebert BL, Gillette MA, Paulovich A, Pomeroy SL, Golub TR, Lander ES, and Mesirov JP (2005). Gene set enrichment analysis: a knowledge-based approach for interpreting genome-wide expression profiles. Proc Natl Acad Sci U S A 102, 15545–15550. 10.1073/pnas.0506580102. [DOI] [PMC free article] [PubMed] [Google Scholar]
- 29.Huang YF, Aoki K, Akase S, Ishihara M, Liu YS, Yang G, Kizuka Y, Mizumoto S, Tiemeyer M, Gao XD, et al. (2021). Global mapping of glycosylation pathways in human-derived cells. Dev Cell 56, 1195–1209 e1197. 10.1016/j.devcel.2021.02.023. [DOI] [PMC free article] [PubMed] [Google Scholar]
- 30.Yamada I, Shiota M, Shinmachi D, Ono T, Tsuchiya S, Hosoda M, Fujita A, Aoki NP, Watanabe Y, Fujita N, et al. (2020). The GlyCosmos Portal: a unified and comprehensive web resource for the glycosciences. Nat Methods 17, 649–650. 10.1038/s41592-020-0879-8. [DOI] [PubMed] [Google Scholar]
- 31.Thomsson KA, Holmen-Larsson JM, Angstrom J, Johansson ME, Xia L, and Hansson GC (2012). Detailed O-glycomics of the Muc2 mucin from colon of wild-type, core 1- and core 3-transferase-deficient mice highlights differences compared with human MUC2. Glycobiology 22, 1128–1139. 10.1093/glycob/cws083. [DOI] [PMC free article] [PubMed] [Google Scholar]
- 32.Tailford LE, Crost EH, Kavanaugh D, and Juge N (2015). Mucin glycan foraging in the human gut microbiome. Front Genet 6, 81. 10.3389/fgene.2015.00081. [DOI] [PMC free article] [PubMed] [Google Scholar]
- 33.Yamada T, Hino S, Iijima H, Genda T, Aoki R, Nagata R, Han KH, Hirota M, Kinashi Y, Oguchi H, et al. (2019). Mucin O-glycans facilitate symbiosynthesis to maintain gut immune homeostasis. EBioMedicine 48, 513–525. 10.1016/j.ebiom.2019.09.008. [DOI] [PMC free article] [PubMed] [Google Scholar]
- 34.Rosenberg EZ-R, I. (2013). Microbiotas are Transmitted Between Holobiont Generations. In The Hologenome Concept: Human, Animal and Plant Microbiota, (Springer, Cham; ). 10.1007/978-3-319-04241-1_4. [DOI] [Google Scholar]
- 35.Martinez DE, Dirksen ML, Bode PM, Jamrich M, Steele RE, and Bode HR (1997). Budhead, a fork head/HNF-3 homologue, is expressed during axis formation and head specification in hydra. Dev Biol 192, 523–536. 10.1006/dbio.1997.8715. [DOI] [PubMed] [Google Scholar]
- 36.Fritzenwanker JH, Saina M, and Technau U (2004). Analysis of forkhead and snail expression reveals epithelial-mesenchymal transitions during embryonic and larval development of Nematostella vectensis. Dev Biol 275, 389–402. 10.1016/j.ydbio.2004.08.014. [DOI] [PubMed] [Google Scholar]
- 37.Monaghan AP, Kaestner KH, Grau E, and Schutz G (1993). Postimplantation expression patterns indicate a role for the mouse forkhead/HNF-3 alpha, beta and gamma genes in determination of the definitive endoderm, chordamesoderm and neuroectoderm. Development 119, 567–578. [DOI] [PubMed] [Google Scholar]
- 38.Ruiz i Altaba A, and Jessell TM (1992). Pintallavis, a gene expressed in the organizer and midline cells of frog embryos: involvement in the development of the neural axis. Development 116, 81–93. [DOI] [PubMed] [Google Scholar]
- 39.Strahle U, Blader P, Henrique D, and Ingham PW (1993). Axial, a zebrafish gene expressed along the developing body axis, shows altered expression in cyclops mutant embryos. Genes Dev 7, 1436–1446. 10.1101/gad.7.7b.1436. [DOI] [PubMed] [Google Scholar]
- 40.Ang SL, and Rossant J (1994). HNF-3 beta is essential for node and notochord formation in mouse development. Cell 78, 561–574. 10.1016/0092-8674(94)90522-3. [DOI] [PubMed] [Google Scholar]
- 41.Weinstein DC, Ruiz i Altaba A, Chen WS, Hoodless P, Prezioso VR, Jessell TM, and Darnell JE Jr. (1994). The winged-helix transcription factor HNF-3 beta is required for notochord development in the mouse embryo. Cell 78, 575–588. 10.1016/0092-8674(94)90523-1. [DOI] [PubMed] [Google Scholar]
- 42.Nishida A, Inoue R, Inatomi O, Bamba S, Naito Y, and Andoh A (2018). Gut microbiota in the pathogenesis of inflammatory bowel disease. Clin J Gastroenterol 11, 1–10. 10.1007/s12328-017-0813-5. [DOI] [PubMed] [Google Scholar]
- 43.Parker N, Tsai HH, Ryder SD, Raouf AH, and Rhodes JM (1995). Increased rate of sialylation of colonic mucin by cultured ulcerative colitis mucosal explants. Digestion 56, 52–56. 10.1159/000201222. [DOI] [PubMed] [Google Scholar]
- 44.Raouf AH, Tsai HH, Parker N, Hoffman J, Walker RJ, and Rhodes JM (1992). Sulphation of colonic and rectal mucin in inflammatory bowel disease: reduced sulphation of rectal mucus in ulcerative colitis. Clin Sci (Lond) 83, 623–626. 10.1042/cs0830623. [DOI] [PubMed] [Google Scholar]
- 45.Larsson JM, Karlsson H, Crespo JG, Johansson ME, Eklund L, Sjovall H, and Hansson GC (2011). Altered O-glycosylation profile of MUC2 mucin occurs in active ulcerative colitis and is associated with increased inflammation. Inflamm Bowel Dis 17, 2299–2307. 10.1002/ibd.21625. [DOI] [PubMed] [Google Scholar]
- 46.Tang X, Wang W, Hong G, Duan C, Zhu S, Tian Y, Han C, Qian W, Lin R, and Hou X (2021). Gut microbiota-mediated lysophosphatidylcholine generation promotes colitis in intestinal epithelium-specific Fut2 deficiency. J Biomed Sci 28, 20. 10.1186/s12929-021-00711-z. [DOI] [PMC free article] [PubMed] [Google Scholar]
- 47.Fu J, Wei B, Wen T, Johansson ME, Liu X, Bradford E, Thomsson KA, McGee S, Mansour L, Tong M, et al. (2011). Loss of intestinal core 1-derived O-glycans causes spontaneous colitis in mice. J Clin Invest 121, 1657–1666. 10.1172/JCI45538. [DOI] [PMC free article] [PubMed] [Google Scholar]
- 48.Hamer HM, Jonkers D, Venema K, Vanhoutvin S, Troost FJ, and Brummer RJ (2008). Review article: the role of butyrate on colonic function. Aliment Pharmacol Ther 27, 104–119. 10.1111/j.1365-2036.2007.03562.x. [DOI] [PubMed] [Google Scholar]
- 49.Luhrs H, Gerke T, Schauber J, Dusel G, Melcher R, Scheppach W, and Menzel T (2001). Cytokine-activated degradation of inhibitory kappaB protein alpha is inhibited by the short-chain fatty acid butyrate. Int J Colorectal Dis 16, 195–201. 10.1007/s003840100295. [DOI] [PubMed] [Google Scholar]
- 50.Segain JP, Raingeard de la Bletiere D., Bourreille A, Leray V, Gervois N, Rosales C, Ferrier L, Bonnet C, Blottiere HM, and Galmiche JP (2000). Butyrate inhibits inflammatory responses through NFkappaB inhibition: implications for Crohn’s disease. Gut 47, 397–403. 10.1136/gut.47.3.397. [DOI] [PMC free article] [PubMed] [Google Scholar]
- 51.Kudelka MR, Stowell SR, Cummings RD, and Neish AS (2020). Intestinal epithelial glycosylation in homeostasis and gut microbiota interactions in IBD. Nat Rev Gastroenterol Hepatol 17, 597–617. 10.1038/s41575-020-0331-7. [DOI] [PMC free article] [PubMed] [Google Scholar]
- 52.Schulz O, and Pabst O (2013). Antigen sampling in the small intestine. Trends Immunol 34, 155–161. 10.1016/j.it.2012.09.006. [DOI] [PubMed] [Google Scholar]
- 53.Shan M, Gentile M, Yeiser JR, Walland AC, Bornstein VU, Chen K, He B, Cassis L, Bigas A, Cols M, et al. (2013). Mucus enhances gut homeostasis and oral tolerance by delivering immunoregulatory signals. Science 342, 447–453. 10.1126/science.1237910. [DOI] [PMC free article] [PubMed] [Google Scholar]
- 54.Cummings RD (2019). “Stuck on sugars - how carbohydrates regulate cell adhesion, recognition, and signaling”. Glycoconj J 36, 241–257. 10.1007/s10719-019-09876-0. [DOI] [PMC free article] [PubMed] [Google Scholar]
- 55.Bleich A, Mahler M, Most C, Leiter EH, Liebler-Tenorio E, Elson CO, Hedrich HJ, Schlegelberger B, and Sundberg JP (2004). Refined histopathologic scoring system improves power to detect colitis QTL in mice. Mamm Genome 15, 865–871. 10.1007/s00335-004-2392-2. [DOI] [PubMed] [Google Scholar]
- 56.Nolte T, Brander-Weber P, Dangler C, Deschl U, Elwell MR, Greaves P, Hailey R, Leach MW, Pandiri AR, Rogers A, et al. (2016). Nonproliferative and Proliferative Lesions of the Gastrointestinal Tract, Pancreas and Salivary Glands of the Rat and Mouse. J Toxicol Pathol 29, 1S–125S. 10.1293/tox.29.1S. [DOI] [PMC free article] [PubMed] [Google Scholar]
- 57.Johansson ME, and Hansson GC (2012). Preservation of mucus in histological sections, immunostaining of mucins in fixed tissue, and localization of bacteria with FISH. Methods Mol Biol 842, 229–235. 10.1007/978-1-61779-513-8_13. [DOI] [PubMed] [Google Scholar]
- 58.Bray NL, Pimentel H, Melsted P, and Pachter L (2016). Near-optimal probabilistic RNA-seq quantification. Nat Biotechnol 34, 525–527. 10.1038/nbt.3519. [DOI] [PubMed] [Google Scholar]
- 59.Tuteja G, Jensen ST, White P, and Kaestner KH (2008). Cis-regulatory modules in the mammalian liver: composition depends on strength of Foxa2 consensus site. Nucleic Acids Res 36, 4149–4157. 10.1093/nar/gkn366. [DOI] [PMC free article] [PubMed] [Google Scholar]
- 60.Heinz S, Benner C, Spann N, Bertolino E, Lin YC, Laslo P, Cheng JX, Murre C, Singh H, and Glass CK (2010). Simple combinations of lineage-determining transcription factors prime cis-regulatory elements required for macrophage and B cell identities. Mol Cell 38, 576–589. 10.1016/j.molcel.2010.05.004. [DOI] [PMC free article] [PubMed] [Google Scholar]
- 61.Ross-Innes CS, Stark R, Teschendorff AE, Holmes KA, Ali HR, Dunning MJ, Brown GD, Gojis O, Ellis IO, Green AR, et al. (2012). Differential oestrogen receptor binding is associated with clinical outcome in breast cancer. Nature 481, 389–393. 10.1038/nature10730. [DOI] [PMC free article] [PubMed] [Google Scholar]
- 62.McLean CY, Bristor D, Hiller M, Clarke SL, Schaar BT, Lowe CB, Wenger AM, and Bejerano G (2010). GREAT improves functional interpretation of cis-regulatory regions. Nat Biotechnol 28, 495–501. 10.1038/nbt.1630. [DOI] [PMC free article] [PubMed] [Google Scholar]
- 63.Young MD, and Behjati S (2020). SoupX removes ambient RNA contamination from droplet-based single-cell RNA sequencing data. Gigascience 9. 10.1093/gigascience/giaa151. [DOI] [PMC free article] [PubMed] [Google Scholar]
- 64.Billing LJ, Larraufie P, Lewis J, Leiter A, Li J, Lam B, Yeo GS, Goldspink DA, Kay RG, Gribble FM, and Reimann F (2019). Single cell transcriptomic profiling of large intestinal enteroendocrine cells in mice - Identification of selective stimuli for insulin-like peptide-5 and glucagon-like peptide-1 co-expressing cells. Mol Metab 29, 158–169. 10.1016/j.molmet.2019.09.001. [DOI] [PMC free article] [PubMed] [Google Scholar]
- 65.Sasaki N, Sachs N, Wiebrands K, Ellenbroek SI, Fumagalli A, Lyubimova A, Begthel H, van den Born M, van Es JH, Karthaus WR, et al. (2016). Reg4+ deep crypt secretory cells function as epithelial niche for Lgr5+ stem cells in colon. Proc Natl Acad Sci U S A 113, E5399–5407. 10.1073/pnas.1607327113. [DOI] [PMC free article] [PubMed] [Google Scholar]
- 66.Smillie CS, Biton M, Ordovas-Montanes J, Sullivan KM, Burgin G, Graham DB, Herbst RH, Rogel N, Slyper M, Waldman J, et al. (2019). Intra- and Inter-cellular Rewiring of the Human Colon during Ulcerative Colitis. Cell 178, 714–730 e722. 10.1016/j.cell.2019.06.029. [DOI] [PMC free article] [PubMed] [Google Scholar]
- 67.Schulz BL, Packer NH, and Karlsson NG (2002). Small-scale analysis of O-linked oligosaccharides from glycoproteins and mucins separated by gel electrophoresis. Anal Chem 74, 6088–6097. 10.1021/ac025890a. [DOI] [PubMed] [Google Scholar]
- 68.Bolyen E, Rideout JR, Dillon MR, Bokulich NA, Abnet CC, Al-Ghalith GA, Alexander H, Alm EJ, Arumugam M, Asnicar F, et al. (2019). Reproducible, interactive, scalable and extensible microbiome data science using QIIME 2. Nat Biotechnol 37, 852–857. 10.1038/s41587-019-0209-9. [DOI] [PMC free article] [PubMed] [Google Scholar]
- 69.Callahan BJ, McMurdie PJ, Rosen MJ, Han AW, Johnson AJ, and Holmes SP (2016). DADA2: High-resolution sample inference from Illumina amplicon data. Nat Methods 13, 581–583. 10.1038/nmeth.3869. [DOI] [PMC free article] [PubMed] [Google Scholar]
- 70.McDonald D, Price MN, Goodrich J, Nawrocki EP, DeSantis TZ, Probst A, Andersen GL, Knight R, and Hugenholtz P (2012). An improved Greengenes taxonomy with explicit ranks for ecological and evolutionary analyses of bacteria and archaea. ISME J 6, 610–618. 10.1038/ismej.2011.139. [DOI] [PMC free article] [PubMed] [Google Scholar]
- 71.Bokulich NA, Kaehler BD, Rideout JR, Dillon M, Bolyen E, Knight R, Huttley GA, and Gregory Caporaso J (2018). Optimizing taxonomic classification of marker-gene amplicon sequences with QIIME 2’s q2-feature-classifier plugin. Microbiome 6, 90. 10.1186/s40168-018-0470-z. [DOI] [PMC free article] [PubMed] [Google Scholar]
- 72.Katoh K, and Standley DM (2013). MAFFT multiple sequence alignment software version 7: improvements in performance and usability. Mol Biol Evol 30, 772–780. 10.1093/molbev/mst010. [DOI] [PMC free article] [PubMed] [Google Scholar]
- 73.Lozupone C, and Knight R (2005). UniFrac: a new phylogenetic method for comparing microbial communities. Appl Environ Microbiol 71, 8228–8235. 10.1128/AEM.71.12.8228-8235.2005. [DOI] [PMC free article] [PubMed] [Google Scholar]
- 74.Lozupone CA, Hamady M, Kelley ST, and Knight R (2007). Quantitative and qualitative beta diversity measures lead to different insights into factors that structure microbial communities. Appl Environ Microbiol 73, 1576–1585. 10.1128/AEM.01996-06. [DOI] [PMC free article] [PubMed] [Google Scholar]
- 75.Anderson MJ (2001). A new method for non-parametric multivariate analysis of variance. Austral Ecology 26, 32–46. 10.1111/j.1442-9993.2001.01070.pp.x. [DOI] [Google Scholar]
- 76.Clarke EL, Taylor LJ, Zhao C, Connell A, Lee JJ, Fett B, Bushman FD, and Bittinger K (2019). Sunbeam: an extensible pipeline for analyzing metagenomic sequencing experiments. Microbiome 7, 46. 10.1186/s40168-019-0658-x. [DOI] [PMC free article] [PubMed] [Google Scholar]
- 77.Ogata H, Goto S, Sato K, Fujibuchi W, Bono H, and Kanehisa M (1999). KEGG: Kyoto Encyclopedia of Genes and Genomes. Nucleic Acids Res 27, 29–34. 10.1093/nar/27.1.29. [DOI] [PMC free article] [PubMed] [Google Scholar]
- 78.Buchfink B, Xie C, and Huson DH (2015). Fast and sensitive protein alignment using DIAMOND. Nat Methods 12, 59–60. 10.1038/nmeth.3176. [DOI] [PubMed] [Google Scholar]
- 79.Uchiyama T, Irie M, Mori H, Kurokawa K, and Yamada T (2015). FuncTree: Functional Analysis and Visualization for Large-Scale Omics Data. PLoS One 10, e0126967. 10.1371/journal.pone.0126967. [DOI] [PMC free article] [PubMed] [Google Scholar]
- 80.Martens EC, Chiang HC, and Gordon JI (2008). Mucosal glycan foraging enhances fitness and transmission of a saccharolytic human gut bacterial symbiont. Cell Host Microbe 4, 447–457. 10.1016/j.chom.2008.09.007. [DOI] [PMC free article] [PubMed] [Google Scholar]
Associated Data
This section collects any data citations, data availability statements, or supplementary materials included in this article.
Supplementary Materials
Data Availability Statement
The raw sequencing data published in this article can be found in the NCBI repository, accession number PRJNA1091956: https://www.ncbi.nlm.nih.gov/bioproject/PRJNA1091956. The processed data for the RNA-sequencing, ChIP-sequencing, and single-nuclei RNA-sequencing have been deposited at GEO with the accession numbers listed in the key resources table. Raw data from Figure S2 were deposited on Mendeley at http://dx.doi.org/DOI:10.17632/r2h76p84r4.1. Microscopy data reported in this paper will be shared by the lead contact upon request.
Key resources table.
| REAGENT or RESOURCE | SOURCE | IDENTIFIER |
|---|---|---|
| Antibodies | ||
| Mouse anti FOXA1 (IHC) | Millipore Sigma | 05-1466 |
| Rabbit anti FOXA2 (IHC) | Millipore Sigma | 07-633 |
| Mouse anti E-Cadherin | BD Biosciences | 610181 |
| Rabbit anti Epcam | Abcam | ab71916 |
| Rat anti CD45R | BD Biosciences | 550286 |
| Rabbit anti CD3 (SP7) | Novus Biologicals | NB600-1441 |
| Rat anti Ki67 | Invitrogen | 50-245-563 |
| Rabbit anti MUC2 (for immunostaining) | Santa Cruz | sc-15334 |
| Rabbit anti MUC2 (for western blot) | Abcam | ab272692 |
| Mouse anti Tubulin | Sigma | T9026 |
| Mouse anti FOXA1 (ChIP) | Abcam | ab23738 |
| Rabbit anti FOXA2 (ChIP) | Santa Cruz Biotechnology | sc-6554 |
| Rabbit anti CD45 (D3F8Q) | Cell Signaling | 70257 |
| Monoamine Oxidase A (MAO-A) | ||
| Cy2 AffiniPure Donkey Anti-Rabbit IgG | Jackson ImmunoResearch | 711-225-152 |
| Cy5 AffiniPure Donkey Anti-Mouse IgG | Jackson ImmunoResearch | 715-175-151 |
| Cy3 AffiniPure Donkey Anti-Rabbit IgG | Jackson ImmunoResearch | 711-165-152 |
| Cy5 AffiniPure Donkey Anti-Rabbit IgG | Jackson ImmunoResearch | 711-175-152 |
| Cy3 AffiniPure Donkey Anti-Mouse IgG | Jackson ImmunoResearch | 715-165-151 |
| Chemicals, peptides, and recombinant proteins | ||
| R-buffer A | Electron Microscopy Sciences | 62706-10 |
| Cas-block | Thermo Fisher Scientific | 008120 |
| Hoechst 33342 | Thermo Fisher Scientific | H3570 |
| HRP | Vector laboratories | PK-7100 |
| DAB substrate | Vector laboratories | SK-4100 |
| Ulex Europaeus Agglutinin I (UEA I), Fluorescein | Vector laboratories | FL-1061 |
| Maackia Amurensis Lectin II (MAL II), Cy3 | GlycoMatrix | 21511109-1 |
| Wheat Germ Agglutinin (WGA), Rhodamine | Vector laboratories | RL-1022 |
| Carbo-Free Blocking Solution | Vector laboratories | SP-5040-125 |
| TrueBlack® Lipofuscin Autofluorescence Quencher | Biotium | 23007 |
| ProLong™ Gold Antifade Mounting medium | Thermofischer | P36930 |
| FITC-dextran, 3–5 kDa | Sigma-Aldrich | FD4 |
| 5-ethynyl-2’-deoxyuridine (EdU) | Invitrogen | E10187 |
| TRIzol reagent | Invitrogen | 15596026 |
| T4 DNA polymerase | NEB | M0203 |
| Klenow DNA polymerase | NEB | M0210 |
| T4 polynucleotide kinase | NEB | M0201 |
| Klenow Fragment (3’→5’ exo-) | NEB | M0212 |
| Nuclei EZ Lysis Buffer | Sigma | NUC-101 |
| TAQMAN Fast Gene Expression Universal PCR Master Mix | Thermo Fisher Scientific | 4352042 |
| Q5 High-Fidelity DNA Polymerase | NEB | M0491 |
| Critical commercial assays | ||
| Lipocalin-2 DuoSet mouse ELISA kit | R&D systems | DY1857 |
| Click-iT™ EdU Cell Proliferation Kit for Imaging, Alexa Fluor™ 555 dye | Thermo Fisher Scientific | C10338 |
| RNeasy Micro Kit | Qiagen | 74004 |
| High-Capacity cDNA Reverse Transcription Kit | Applied Biosystems | 4374966 |
| Pierce™ BCA Protein Assay Kits | ThermoFisher | 23225 |
| Immobilon Crescendo Western HRP substrate | Millipore | WBLUR0100 |
| RNAscope® Multiplex Fluorescent Detection Reagents V2 | ACD | 323110 |
| HybEZ oven | ACD | PN 321710/321720 |
| RNAscope® Probe Diluent | ACD | 300041 |
| TSA Vivid fluorophore 650 | ACD | 323273 |
| TSA Vivid fluorophore 570 | ACD | 323272 |
| TSA Vivid fluorophore 520 | ACD | 323271 |
| NEBNext Ultra RNA Library Prep Kit for Illumina | NEB | E7530 |
| NEBNext Poly(A) mRNA Magnetic Isolation Module | NEB | E7490 |
| QIAquick PCR Purification Kit | Qiagen | 28104 |
| Chromium Next GEM Single Cell 3′ Reagent Kits v3.1 | 10X genomics | PN-1000121 PN-1000122 |
| DNeasy PowerSoil Pro kit | Qiagen | 47016 |
| Nextera XT DNA Library Preparation Kit | Illumina | FC-131-1096 |
| Deposited data | ||
| Glycan analysis MS raw files at GlycoPOST database: https://glycopost.glycosmos.org/preview/7094574161e18019e3f37 | This paper | GlycoPOST ID: GPST000248 password: 6868 |
| Micrbial 16S sequencing | This paper | PRJNA1091956 |
| Metagenomic sequencing | This paper | PRJNA1091956 |
| RNA sequencing of proximal and distal colon | This paper | PRJNA1091956 and GEO: GSE263630 |
| ChIP sequencing of FOXA1 and FOXA2 | This paper | PRJNA1091956 and GEO: GSE263629 |
| Single nuclei RNA sequencing of distal colon | This paper | PRJNA1091956 and GEO: GSE263631 |
| Unprocessed Western blots | This paper | Mendeley data: http://dx.doi.org/DOI:10.17632/r2h76p84r4.1 |
| Experimental models: Organisms/strains | ||
| Foxa1lox/lox mice | Kaestner lab, University of Pennsylvania | N.A. |
| Foxa2lox/lox mice | Kaestner lab, University of Pennsylvania | N.A. |
| Villin1-Cre mice | Jackson Laboratory | 033019 |
| Oligonucleotides | ||
| EUB338 FISH probe, Cy3-conjugated: 5′-GCTGCCTCCCGTAGGAGT-3′ | IDT | N.A. |
| Nonsense FISH probe, Cy3-conjugated: 5′-CGACGGAGGGCATCCTCA-3′ | IDT | N.A. |
| RNAscope™ Probe- Mm-Foxa2-C2 | ACD | 409111-C2 |
| RNAscope™ Probe- Mm-Muc2-C3 | ACD | 315451-C3 |
| RNAscope™ Probe- Mm-Gcnt3 | ACD | 553881 |
| RNAscope™ Probe- Mm-Fut2 | ACD | 811421 |
| 16s qPCR BSF8 primer: AGAGTTTGATCCTGGCTCAG | IDT | N.A. |
| 16s qPCR BSR357 primer: CTGCTGCCTYCCGTA | IDT | N.A. |
| 16s qPCR Taqman probe: /56-FAM/TAA +CA+C ATG +CA+A GT+C GA/3BHQ 1/ | IDT | N.A. |
| Lcn2 forward primer: CAATGTCACCTCCATCCTGG | IDT | N.A. |
| Lcn2 reverse primer: CCTGGAGCTTGGAACAAATG | IDT | N.A. |
| Tnf forward primer: ACTCCAGGCGGTGCCTATGT | IDT | N.A. |
| Tnf reverse primer: AGTGTGAGGGTCTGGGCCAT | IDT | N.A. |
| Actb forward primer: CACAGCTTCTTTGCAGCTCCT | IDT | N.A. |
| Actb reverse primer: GTCATCCATGGCGAACTGG | IDT | N.A. |
This paper does not report original code.
Any additional information required to reanalyze the data reported in this paper is available from the lead contact upon request.