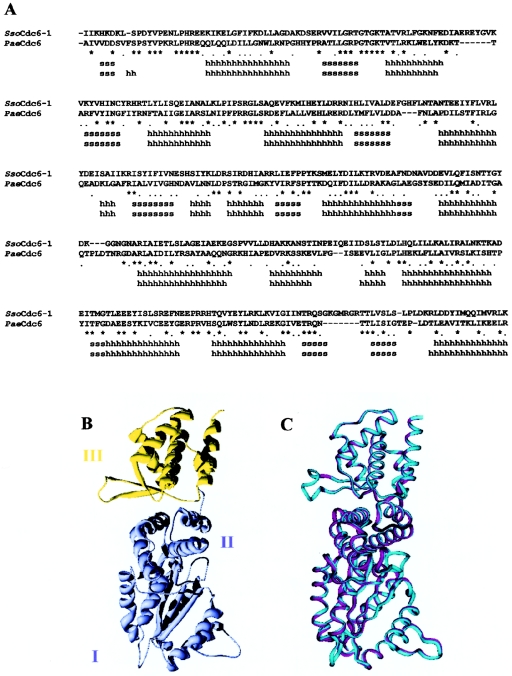
Figure 1. Molecular modelling of SsoCdc6-2.
(A) Structural sequence alignment between SsoCdc6-2 model and the PaeCdc6 structure. Identical or similar residues are marked with an asterisk or a dot respectively. Stretches of ‘s’ or ‘h’ indicate β-strands or α-helices respectively. Superposition and alignment were performed with the Swiss-PDB viewer program [29]. (B) SsoCdc6-2 structural model with a ribbon representation. Domains I and II are coloured pale blue; Domain III (WH) is coloured yellow. (C) Superposition of the SsoCdc6-2 model (cyan) and PaeCdc6 structure (magenta). Pictures were generated with the Swiss-PDB viewer program [29] and rendered with POV (Persistance of Vision) ray for Windows v. 3.1.

