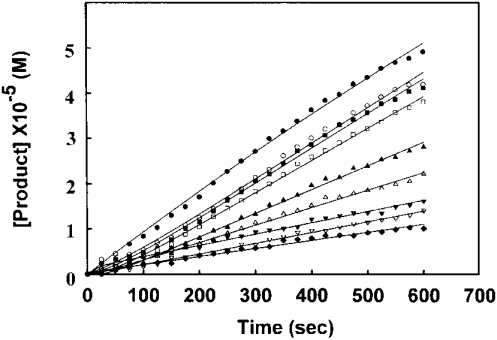
Figure 2. Progress curves for the inhibition of FabI by triclosan.
The reaction mixture contained 100 μM NADH, 200 μM crotonoyl-CoA, 50 μM NAD+, 0.2 μM enzyme in 20 mM Tris/HCl (pH 7.4) and different concentrations of triclosan (0, 800 nM; from top to bottom) at 25 °C. The data were fitted to eqn (2) and the lines indicate the best fits of the data.

