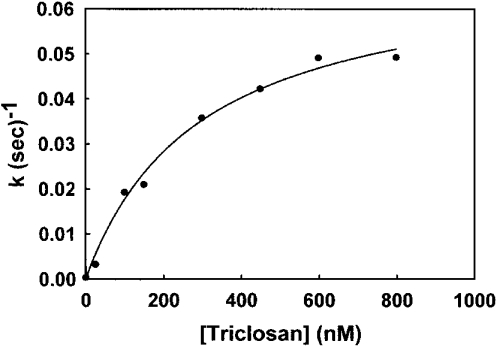
Figure 4. Dependence of the initial rate of FabI reaction on triclosan concentration.
The apparent rate constant k was calculated from an analysis of progress curves. The data fit well to eqn (3), demonstrating a two-step mechanism for the inhibition of FabI by triclosan.

