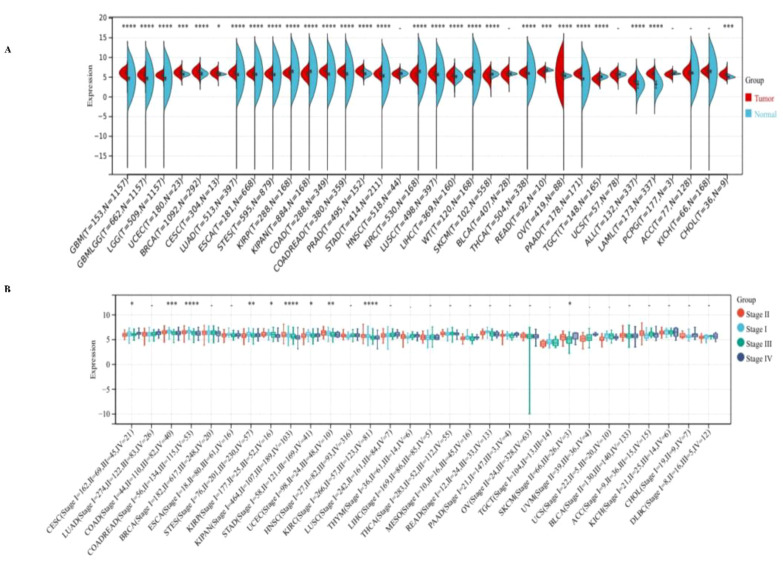
Figure 1.
Expression levels of PPA2 in different tumors and pathological stages by TCGA + GTEx database. (A) Expression levels of PPPA2 in different tumors vs corresponding controls were analyzed (B) Analysis of the expression difference of the PPA2 gene in samples of different clinical stages in each tumor. *P<0.05; **P<0.01; ***P<0.001; ****P<0.0001.

