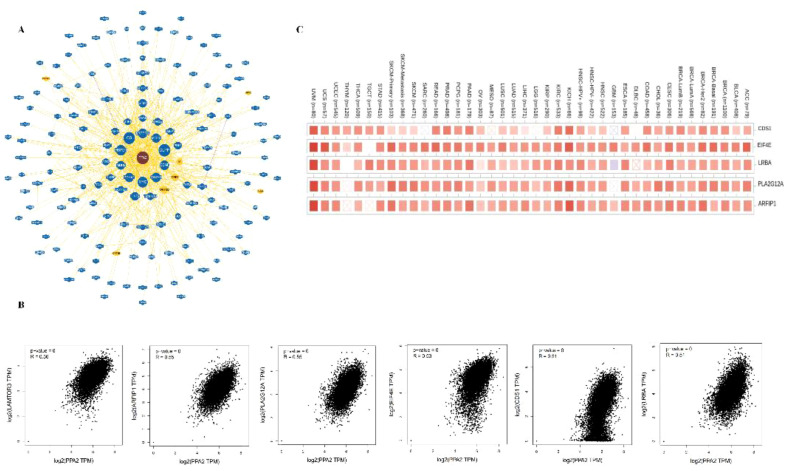
Figure 5.
The Protein-protein interaction analysis of PPA2. (A) PPA2-related genes were obtained from the BioGRID web tool (B) GEPIA2.0 showed positive correlations between PPA2 and six genes (LAMTOR3, CDS1, EIF4E, LRBA, PLA2G12A, and ARFIP1). (C) The heatmap indicated that PPA2 expression was positively correlated with these genes (CDS1, EIF4E, LRBA, PLA2G12A, and ARFIP1) in pan-cancer.

