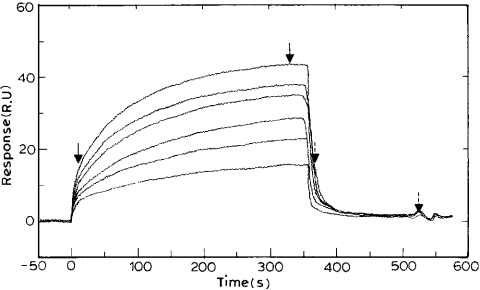
Figure 1. Sensorgram depicting the binding of crotonoyl-CoA to PfENR.
Varying concentrations of crotonoyl-CoA (5, 10, 15, 20, 25 and 30 μM) dissolved in 10 mM Hepes buffer, containing 150 mM NaCl/3.4 mM EDTA, pH 7.4, were passed over the immobilized PfENR at a flow rate of 10 μl/min. The dissociation was studied subsequently by passing the same buffer at a flow rate of 10 μl/min. The fit of the sensorgram yielded association and dissociation values of 1.28×10³ M−1·s−1 and 0.08 s−1 respectively, and an Rmax of 45. The first two arrows mark the regions selected to obtain the association rate constant. The other two arrows (with broken line) mark the regions selected to obtain the dissociation rate constant.

