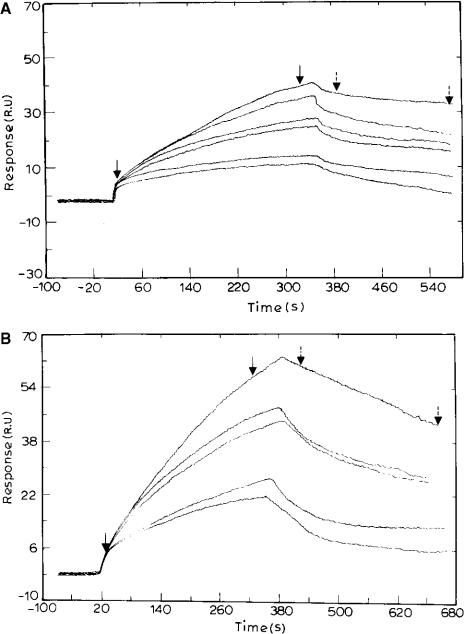
Figure 3. Sensorgram depicting the binding of triclosan to ENR in the absence (A) and presence (B) of NAD+.
(A) Various concentrations of triclosan (0.4, 0.8, 1, 1.5, 3 and 4 μM) were passed over the immobilized PfENR. The surfaces were regenerated by a 10-s pulse of 10 mM glycine/HCl (pH 4.2) flowing at 50 μl/min. The fit of the sensorgram yielded association and dissociation values of 741 M−1·s−1 and 6.84×10⁻³ s−1 respectively, and an Rmax of 150. (B) NAD+ was passed over immobilized PfENR for 1 h followed by varying concentrations of triclosan (0.4, 0.8, 1, 1.5 and 3 μM). The fit of the curve yielded forward and reverse rate constants of 1.3×10⁴ M−1·s−1and 4.2×10⁻⁴ s−1 respectively, and an Rmax of 175.

