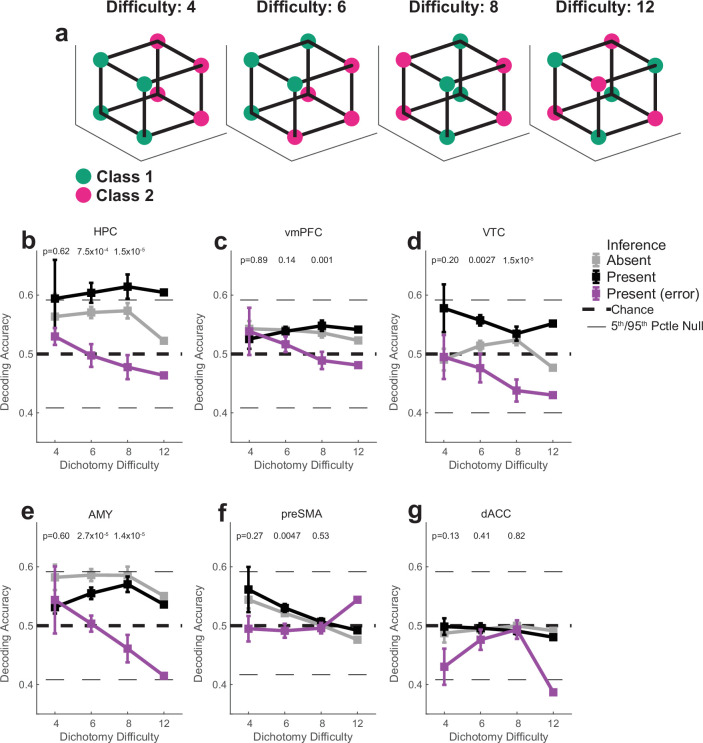
Extended Data Fig. 5. Effect of inference and errors on shattering dimensionality as a function of dichotomy difficulty.
“Dichotomy difficulty” quantifies the amount of non-linear interaction of task variables needed in a population of neurons to decode a given dichotomy (see methods). (a) Example dichotomies of increasing difficulty. The difficulty 4 dichotomy corresponds to context and difficulty 12 dichotomy corresponds to parity (Extended Data Fig. 2). (b-g) Decoding accuracy as a function of dichotomy difficulty for different brain regions. Reported values (mean +/− SEM) are computed over dichotomy decoding accuracies, where the average decoding accuracy for each dichotomy is computed with 1000 repetitions of re-sampled estimation (see methods). Black dashed lines indicate chance level (50% for binary decoding), horizontal black lines indicate the 5th and 95th pctle of the null distribution. P-values are computed by conducting a one-way ANOVA over dichotomies independently for every dichotomy difficulty (Bonferroni multipe comparison corrected). This value is not meaningfully computable for difficulty 12, which contains a single dichotomy (the parity dichotomy), and is therefore not reported. Decoding accuracy from the hippocampus (b) is higher in inference present compared to inference present sessions. In error trials, decoding is at chance. n = 1000 random resamples.

