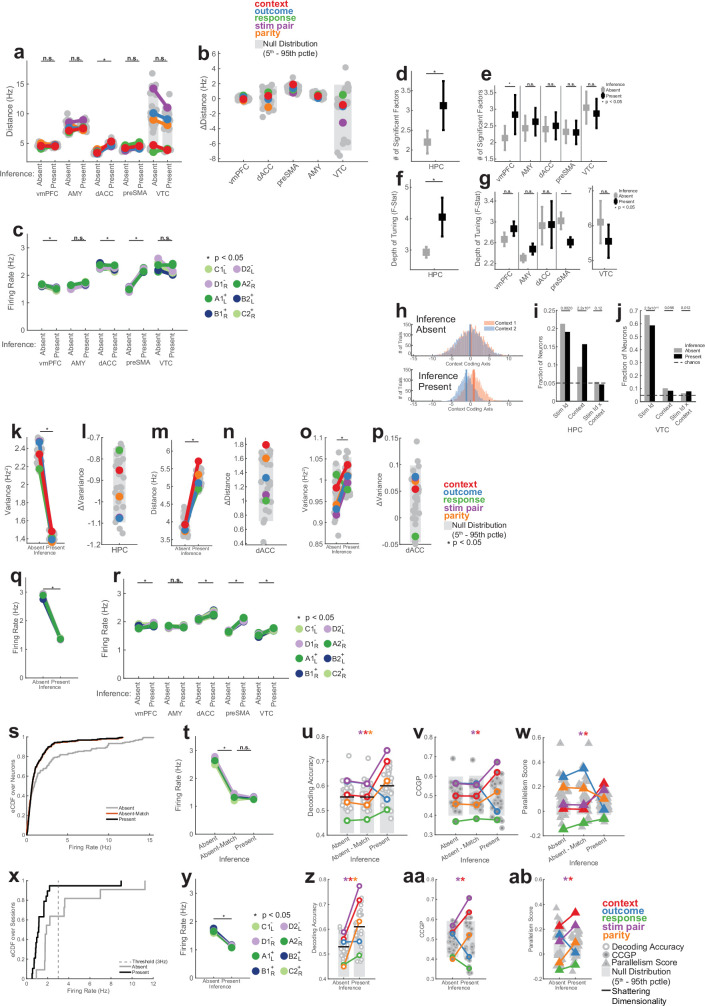
Extended Data Fig. 9. Additional analysis for firing rate property changes that are underlying geometric changes.
(a-j) Stimulus period analysis. (a) Distance between centroids for other brain regions. Plotting conventions are identical to Fig. 4g. Neuron counts were only balanced for each region. Significant change in average dichotomy separation determined by a two-tailed ranksum test, Bonferroni corrected for 5 multiple comparions. (b) Changes in inter-centroid distance for balanced dichotomies. No distances for named dichotomies changed more than would be expected by chance. (c) Mean firing rates for individual task conditions for all regions other than HPC. See Fig. 4e for notation. Significant change in average dichotomy separation determined by a two-tailed ranksum test, Bonferroni corrected for 5 multiple comparions. (d-g) Changes in single-neuron tuning quantified by a 3-way ANOVA (Response, Context, Outcome) with interactions. Significant factors (p < 0.05) were identified for every neuron and averages of both the number of factors per neuron (d,e) and the depth of tuning of those factors quantified by the F-Statistic (e,g) are reported (mean ± s.e.m. across neurons). Significance of difference between inference absent and present sessions was assessed by two-tailed ranksum test over significant neurons between the two groups. n = 58,47,24,22,96,118 for HPC, vmPFC, AMY, dACC, preSMA, and VTC, respectively. (h) Assessment of single trial variability of context coding. For each trial, the population response was projected onto the coding axis for context. Vertical lines indicating the mean. (i-j) Fraction of hippocampal (i) and VTC (j) neurons that exhibit selectivity for a given variable. For every neuron, selectivity is determined with a 4 × 2 ANOVA (Stimulus Identity, Context), with a per-factor significance threshold of p < 0.05. Significant differences in tuned fractions between inference absent and inference present assessed with two-tailed z-test. (k-r) Baseline period analysis for hippocampus (k-l) and dACC (m-p). (k) Average trial-by-trial variance of individual trials projected onto the coding direction for every dichotomy. See Fig. 4i for notation. Average variance along coding directions decreased significantly between inference absent and inference present sessions (pRS = 6.5 × 10⁻¹³, ranksum over dichotomies). (l) Change in variance for all dichotomies shown in (k). No named dichotomies fell outside the null distribution. (m-n) Same as (a,b) but for the dACC at baseline. See Fig. 4g for plotting conventions. Average distance between dichotomy centroids increased (pRS = 2.9 × 10⁻⁸, ranksum over dichotomies). Context was significantly separated (pAbsent = 0.48, pPresent = 0.0065). (n) Changes in distance between inference present and inference absent sessions for all dichotomies shown in (m). Context alone (red, pΔ = 0.047) exhibited a greater increase in distance than expected by chance. (o-p) Same as (k-l), but for he dACC. Average variance along coding directions increased significantly (pRS = 6.0 × 10⁻³, ranksum over dichotomies). (q) Mean baseline firing rates in hippocampus (pRS = 1.6 × 10⁻⁴, ranksum over conditions). See Fig. 4e for plotting conventions. Ranksum test over conditions. (r) Same as (q) but for the other brain areas. Ranksum test over conditions. Note that all brain regions other than AMY exhibit slight but significant increases (pRS = 0.050, 0.23, 1.6 × 10⁻⁴, 1.6 × 10⁻⁴, and 1.6 × 10⁻⁴ for vmPFC, AMY, dACC, preSMA, and VTC, respectively). (s-w) Control analysis for stimulus period after distribution-matching for firing rate. (s) Distribution of mean stimulus firing rates over all hippocampal neurons in the inference absent (gray) and inference present (black) sessions, as well as randomly thinned inference absent firing rates that distribution-match the inference present firing rates (orange). (t) Mean firing rates before and after distribution matching. Ranksum test over conditions. pRS = 1.6 × 10⁻⁴ for absent vs. absent-match. (u-w) Replication of key results for the set of neurons that are distribution matched. Plotting conventions are those shown in Fig. 2. No meaningful differences are present between inference absent and distribution-matched inference absent for any dichotomy/metric. (u) pPresent = 1.8 × 10⁻⁶, pPresent = 6.4 × 10⁻⁶, and pPresent = 0.016 for context, stim pair, and parity respectively. (v) pPresent = 0.035 and pPresent = 0.0047 for context and stim pair. (w) pPresent = 7.2 × 10⁻¹⁰ and pPresent = 3.6 × 10⁻⁶ for context and stim pair. (x-ab) Control analysis for stimulus period after excluding high-hippocampal-firing-rate sessions. (x) Distribution of mean hippocampal firing rate over inference absent (gray) and inference present (black) sessions. Each point in the distribution corresponds to the mean hippocampal firing rate over all neurons in a single session. Vertical dashed line indicates 3 Hz threshold. Hippocampal neurons from all inference absent and inference present sessions above this threshold were excluded from analysis shown in (y-ab). 131/169 inference absent neurons (10/14 sessions) and 318/325 inference present neurons (21/22 sessions) are retained. (y) Same as (t), but computed using all sessions with mean hippocampal firing rate <3 Hz (pRS = 1.6 × 10⁻⁴). (z-ab) Neural geometry measures re-computed excluding hippocampal neurons from high-firing-rate sessions. No meaningful differences are apparent except the above-chance context PS in inference absent sessions (red, pAbsent = 2.2 × 10⁻⁸). In all panels, * indicates p < 0.05 and ns indicates not significant. All pAbsent, and pPresent values stated are estimated empirically based on the null distribution shown. All pRS values stated are a two-sided ranksum test.

