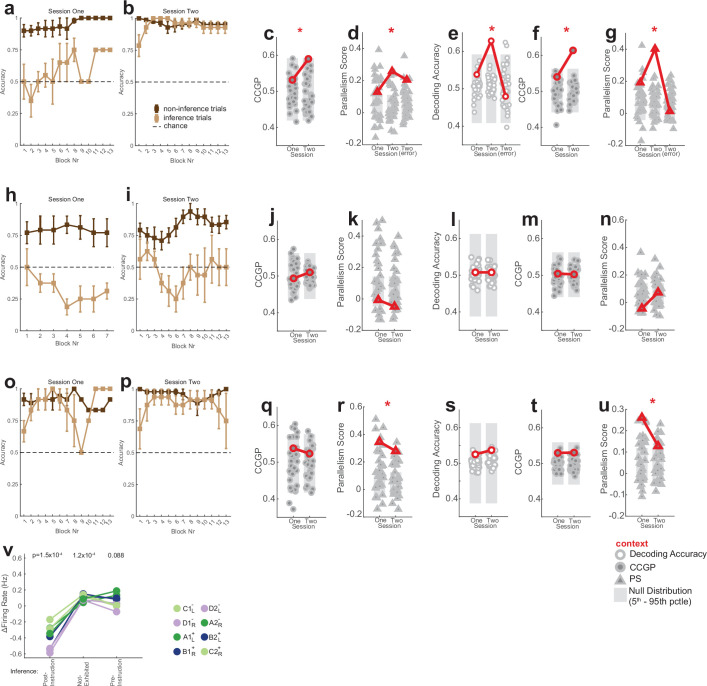
Extended Data Fig. 10. Additional analysis of the effect of instructions on hippocampal neural geometry.
(a-g) Post-instruction inference group. (a-b) Behavior. Identical to Extended Data Fig. 1e,f, except now the session recorded immediately preceding and immediately following verbal instructions are shown. Average performance is computed as a moving average with a 3-block window on the last three trials before a context switch (non-inference) and on the first inference trial after a switch (inference). Error bars are standard errors computed over subjects. Chance performance is 0.5. (c-d) Geometric measures during the stimulus period. Only context is shown as a named dichotomy for visual clarity. (c) CCGP (context, red, pOne = 0.27, pTwo = 0.046, pRS = 1.4 × 10⁻³¹) and (d) PS (context, red, pOne = 0.029, pTwo = 3.5 × 10⁻⁶, pTwo(error) = 0.0028). (e-g) Geometric measures during the baseline period. (e) Decoding accuracy (context, red, pOne = 0.35, pTwo = 0.0014, pTwo(error) = 0.55, pRS = 1.4 × 10⁻²⁰). (f) CCGP (context, red, pOne = 0.33, pTwo = 0.0037, pRS = 3.0 × 10⁻³⁴). (g) PS (context, red, pOne = 0.017, pTwo = 7.5 × 10⁻⁸, pTwo(error) = 0.40). (h-n) Same as (a-g), but for inference not-exhibited group. (j-k) Geometric measures during the stimulus period. (j) CCGP (context, red, pOne = 0.56, pTwo = 0.39, pRS = 0.004). (k) PS (context, red, pOne = 0.81, pTwo = 0.95). (l-n) Geometric measures during the baseline period. (l) Decoding accuracy (context, red, pOne = 0.45, pTwo = 0.45, pRS = 0.68). (m) CCGP (context, red, pOne = 0.45, pTwo = 0.47, pRS = 0.15). (n) PS (context, red, pOne = 0.93, pTwo = 0.30) for the. (o-u) Same as (a-g), but for the pre-instruction inference group. (q-r) Geometric measures during the stimulus period. (q) CCGP (context, red, pOne = 0.23, pTwo = 0.19, pRS = 0.0045). (r) Parallelism Score (context, red, pOne = 6.3 × 10⁻⁸, pTwo = 4.5 × 10⁻⁷). (s-u) Geometric measures during the baseline period. (s) Decoding accuracy (context, red, pOne = 0.37, pTwo = 0.47, pRS = 0.036), (t) CCGP (context, red, pOne = 0.30, pTwo = 0.50, pRS = 5.9 × 10⁻⁷), and (u) PS (context, red, pOne = 1.7 × 10⁻⁵, pTwo = 0.029). (v) Changes in hippocampal firing rates for the 3 different sub-groups of session pairs. Firing rate changes are computed during the stimulus presentation period (0.2 s to 1.2 s after stim onset) from consecutive sessions. Points are average changes in condition-averaged firing rates (8 unique conditions). Changes in firing rate that significantly differed from zero (two-sided t-test, p < 0.05/3, boneferroni corrected) are indicated with a “*” (p = 1.5 × 10⁻⁴, 1.2 × 10⁻⁴, and 0.088). Post-instruction inference group alone exhibited significant decrease in firing rate. Inference not-exhibited group exhibited an increase in firing rate. In all panels stated p-values denoted as pOne and pTwo are estimated empirically based on the null distribution shown. All pRS values stated are a two-way ranksum test.

