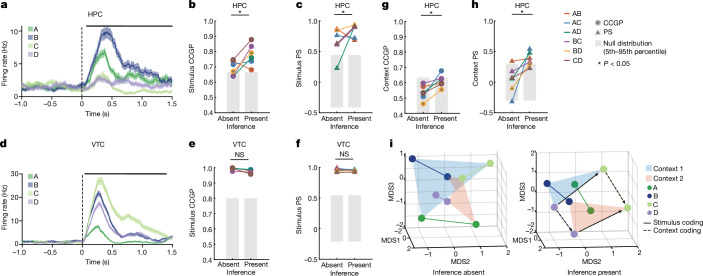
Fig. 3. Stimulus representations become structured around context with inference in hippocampus but not VTC.
a–f, Encoding of stimulus identity across contexts. a–c, Responses in hippocampus (HPC) following stimulus onset carry information about stimulus identity. a, Example hippocampal neuron encoding stimulus identity. b,c, Representational geometry of stimulus identity across contexts. Analysis is conducted over pairs of stimuli in each context (legend). Significance of differences is tested using a two-sided rank-sum test comparing inference absent and present over all stimulus pairs (*P < 0.05, NS otherwise). All other conventions identical to those in Fig. 2. b,c, CCGP (PRS = 0.041) (b) and PS (PRS = 0.040) (c) for stimulus coding across contexts significantly increased in inference present compared to inference absent sessions. d–f, Responses in VTC following stimulus onset carry information about stimulus identity. d, Example VTC neuron encoding stimulus identity. e,f, CCGP (PRS = 0.15) (e) and PS (PRS = 0.39) (f) for stimulus coding across contexts does not differ significantly between inference absent and inference present sessions. g,h, Same analysis as in a–f, but for encoding of context across stimulus pairs for hippocampus (see b,c for plotting conventions). CCGP (PRS = 0.012) (g) and PS for context coding vectors between pairs of stimuli (PRS = 0.015) (h) both significantly increase from inference absent to inference present sessions. i, Summary of changes in neural geometry in hippocampus. Shown is the MDS of condition-averaged responses of all recorded neurons shown for inference absent and present sessions. Points are average population vector responses to combinations of stimuli and context. Lines connect the same stimuli across context. Abstract coding of stimulus across contexts (solid arrows) and context across stimuli (dashed arrows) are highlighted for one pair of stimuli (C and D). The data in this plot are identical to those of Fig. 2j. Error bars in a,d are ±s.e.m. across trials. All PRS values are from a two-sided rank-sum test.

