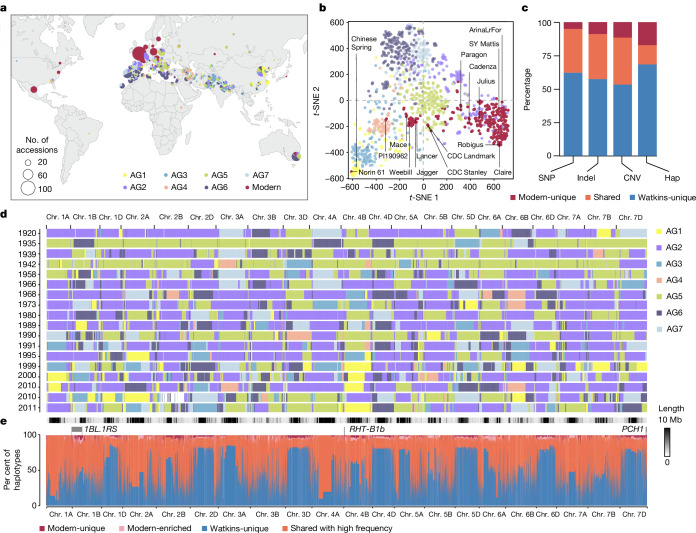
Fig. 1. Genomic variants in Watkins landraces compared with modern wheat.
a, Geographical distribution of all accessions, including the entire Watkins collection (n = 827) and modern wheat cultivars that are the outputs of breeding programmes (n = 224; comprising 208 cultivars sequenced in this study and 15 previously described wheat cultivars from the 10+ Wheat Genomes Project10 as well as Chinese Spring). The seven ancestral groups (AG1–AG7, derived from Watkins) and modern wheat are colour-coded. b, t-SNE plot based on the 10 million SNPs shared by different ancestral groups. The SNPs were stringently controlled by LD (see Methods), with AG1–7 and modern wheat colour-coded as in a. The distribution of the 15 lines from the 10+ Wheat Genomes Project10 and Chinese Spring are shown. c, Percentage of Watkins-unique, shared and modern-unique variants for SNPs, short (<50 bp) insertion–deletion mutations (indels), gene copy number variations (CNV) and haplotypes (hap). d, k-mer based IBSpy long-range haplotype analysis of the selected 18 representative modern wheat cultivars (released from 1920 to 2011). IBS regions shared between these 18 modern wheat lines and the Watkins landraces are shown as coloured blocks according to the source of the detected Watkins accessions from the different ancestral subgroups (top 100 Watkins accessions; Supplementary Table 7; see Methods and ref. 16). e, Genomic distribution and comparison of haplotypes between Watkins and modern wheat along the 21 chromosomes, including the proportion of haplotypes that are absent (Watkins-unique), shared with high frequency, modern-enriched or unique to modern wheat. The haplotypes were identified based on LD by PLINK (Methods), with single-base-resolution based on the IWGSC RefSeq v1.0 reference genome.

