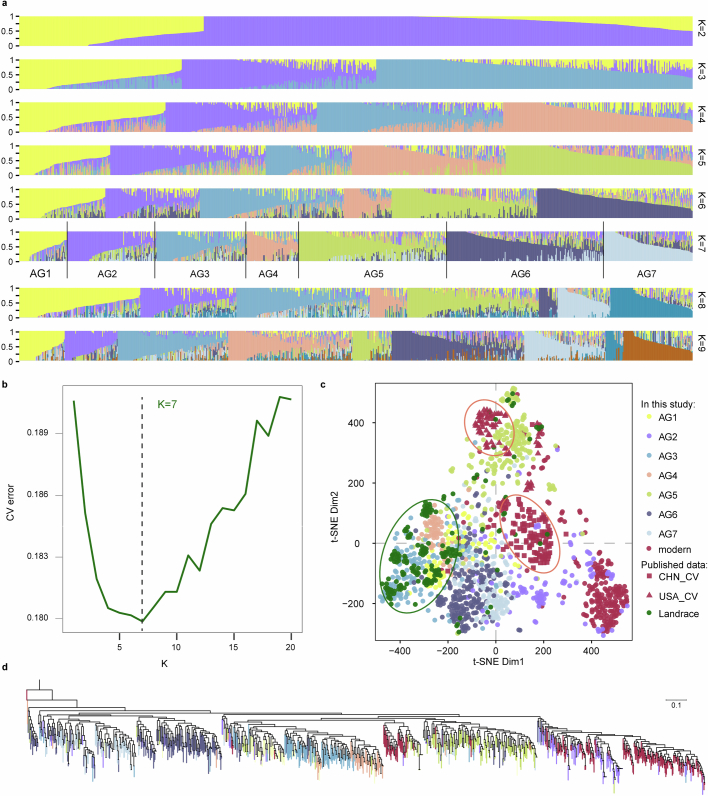
Extended Data Fig. 2. Population structure and phylogenetic analysis of Watkins landraces and modern wheat cultivars.
a, Genome-wide ADMIXTURE (Maximum Likelihood Estimation) results for 827 Watkins landraces from K = 2 to K = 9. Each colour represents an ancestral population. The length of each segment in each vertical bar represents the proportion contributed by ancestral populations. b, Estimated CV error for different K values (from K = 2 to K = 20) in the ADMIXTURE analysis with a K of 7 designating the ancestral groups (AGs) identified here. c, dim1 and dim2 plots of t-SNE results using PLINK haplotypes, for the merged variation matrix (4 M shared SNPs) between the SNP matrix built in this study (the 10 M core SNPs, see Methods) and the published dataset (76 M SNPs) from Niu et al.13. d, Phylogenetic reconstruction of a set of 133,222 4DTv sites using Maximum Likelihood Estimation with 1000 bootstrap replicates, corresponding to Fig. 2a with the ancestral groups (AG1-7) color-coded. It is worth noting that a subjective observation of the phylogenetic analysis of Watkins based on the maximum likelihood method (Extended Data Fig. 2d), largely places individual accessions of each ancestral group beneath common branchpoints of the phylogenetic tree. Instances where this is not observed reveal extensive admixture (Extended Data Fig. 2a, Supplementary Table 4). The highest level of admixture for AG2 is from AG5 (approximately 11.2%), for AG5 it is from AG7 (approximately 7.5%). This reflects the reticulate relationship among these ancestral groups and further demonstrates the need for alternative methods, particularly sophisticated models reliant on haplotype-based clustering for accurate inference of ancient wheat populations10.

