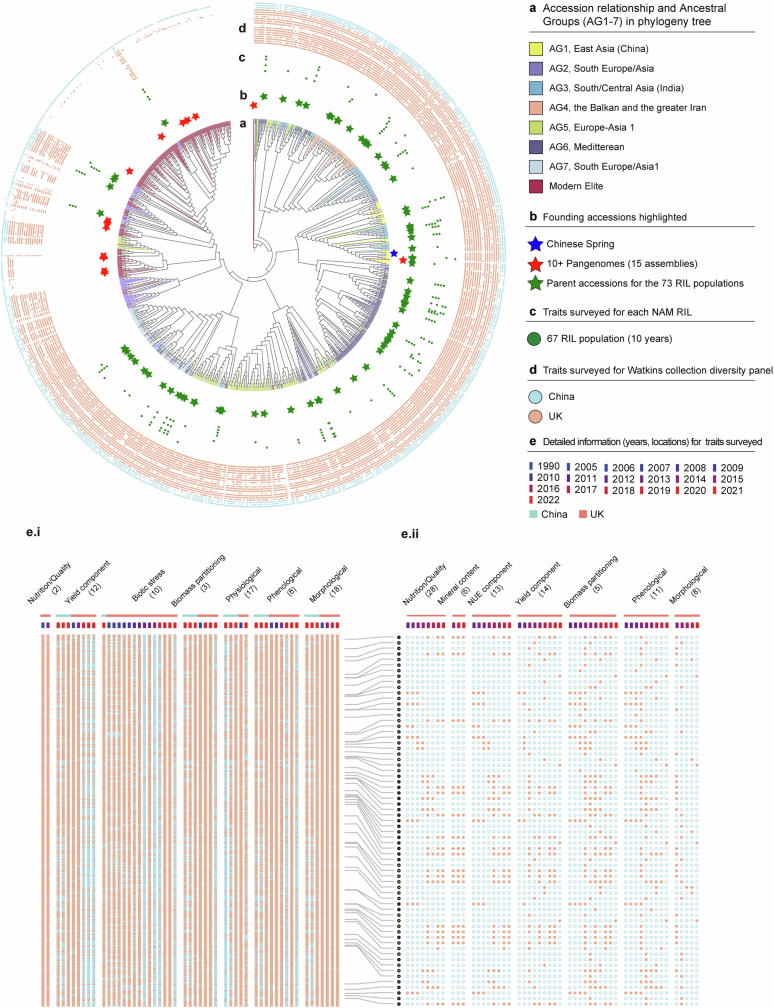
Extended Data Fig. 4. Watkins collection and mapping populations, phenotypic resources and traits surveyed summarised in a phylogeny-based circular diagram.
a, Phylogenetic tree of the wheat accessions examined in this study. The phylogenetic tree was constructed using a set of 133,222 four-fold degenerate sites using rapidNJ with 1000 bootstrap replicates. The seven ancestral groups (AG1–7) and modern wheats are colour-coded as in Fig. 1a. b, The founder parents (green stars) of 73 Watkins x Paragon RIL populations are marked, the 15 pan-genome lines (red stars) and Chinese Spring (blue star) are indicated on the phylogenetic tree. c, Traits surveyed in multiple environments and multiple years for each of the NAM RIL populations, in which the corresponding Watkins line was used as the non-common parent. Each track represents a year (total of 10 years: 2011, 2012, 2013, 2014, 2015, 2016, 2017, 2018, 2019 and 2020). d, Traits surveyed in multiple environments and multiple years for the Watkins collection diversity panel (natural populations) grown in five geographic locations across China (blue circle, four years: 2020, 2021, 2022, 2023) and the UK (orange circle, 16 years: 1990, 2005, 2006, 2007, 2008, 2009, 2010, 2011, 2012, 2013, 2014, 2015, 2018, 2019, 2020 and 2021). e, Magnified view of data from the detailed field experiments, traits and phenotyping datasets as indicated in track d, including the traits surveyed in the Watkins collection diversity panel in multiple environments (e.i) and in multiple years (left) and in the RIL populations (NAM RILs) in multiple environments and in multiple years (e.ii).

