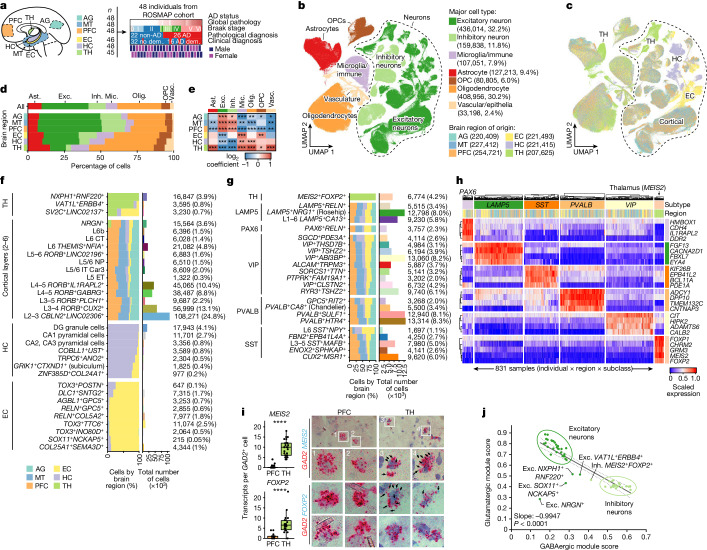
Fig. 1. snRNA-seq analysis of six distinct regions of the aged human brain.
a, snRNA-seq profiling summary, covering 283 samples across 6 brain regions from 48 participants from ROSMAP, showing global pathology, Braak stage and pathological (26 AD and 22 non-AD) or clinical diagnosis of AD (16 AD dementia (dem.) and 32 no dementia). b,c, Joint uniform manifold approximation and projection (UMAP), coloured by major cell type (b) and region of origin (c). d, The regional composition of major cell types. e, Relative enrichment of major cell types across regions by quasi-binomial regression. False discovery rate (FDR)-corrected P values are indicated by asterisks; ***P < 0.001, **P < 0.01, *P < 0.05. f,g, Global breakdown, region composition, enrichment and number of nuclei for excitatory (f) and inhibitory (g) neuronal subtypes. h, Gene expression analysis of the top four markers per inhibitory subclass, averaged at the sample by subclass level (columns). i, RNAscope validation of FOXP2 and MEIS2 as markers of the unique thalamus subtype, with quantification (left) performed using Student’s t-tests and representative images (right). The blue puncta represent MEIS2 (top) or FOXP2 (bottom) transcripts and red puncta represent GAD2 transcripts. FOXP2: n = 19 (PFC) and n = 22 (TH) cells; MEIS2: n = 35 (PFC) and n = 26 (TH) cells; each dot represents an individual cell, pooled from eight samples (four individuals; each had one PFC and one thalamus sample). j, Glutamatergic versus GABAergic scores for all neuron subtypes. The dotted lines represent the 95% confidence interval around the linear fit. P values were calculated using two-sided F tests. Ast., astrocytes; exc., excitatory neurons; inh., inhibitory neurons; mic., microglia/immune cells; olig., oligodendrocytes; vasc., vascular/epithelial cells.

