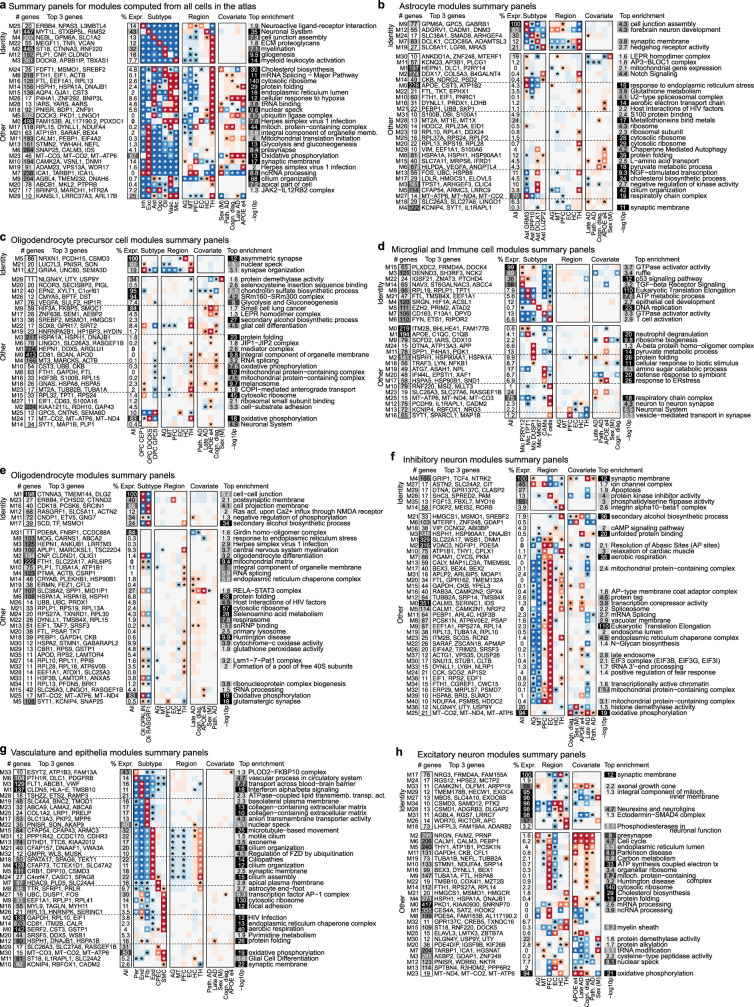
Extended Data Fig. 5. Module summary panels across modules.
a-h, Overview of gene expression modules with at least 10 genes each across all cells and across major cell types, showing the module name, number of genes, percent expression, top module genes, enrichments by subtype (except for neuron subtypes, see Supplement), covariates, and regions, and the top functional enrichment for each module. Percent expression is the percent of cells whose average expression (log1p, normalized) of the module is above 1. Covariate enrichments are performed by hypergeometric test, comparing the intersection of cells with z-scored module expression of at least 1 vs. with z < 1 against a particular level of a covariate of interest (e.g. cells from the entorhinal cortex region or cells of a specific subtype). Panels summarize modules found in all cells (a), astrocytes (b), OPCs (c), microglia and immune cells (d), oligodendrocytes (e), inhibitory neurons (f), vasculature and epithelia (g), and excitatory neurons (h). All modules except vasculature and epithelia modules are split into identity vs. other, where identity modules are highly enriched in a single subtype and have an average expression greater than 1 (log1p, normalized) for over 50% of the subtype’s cells.

