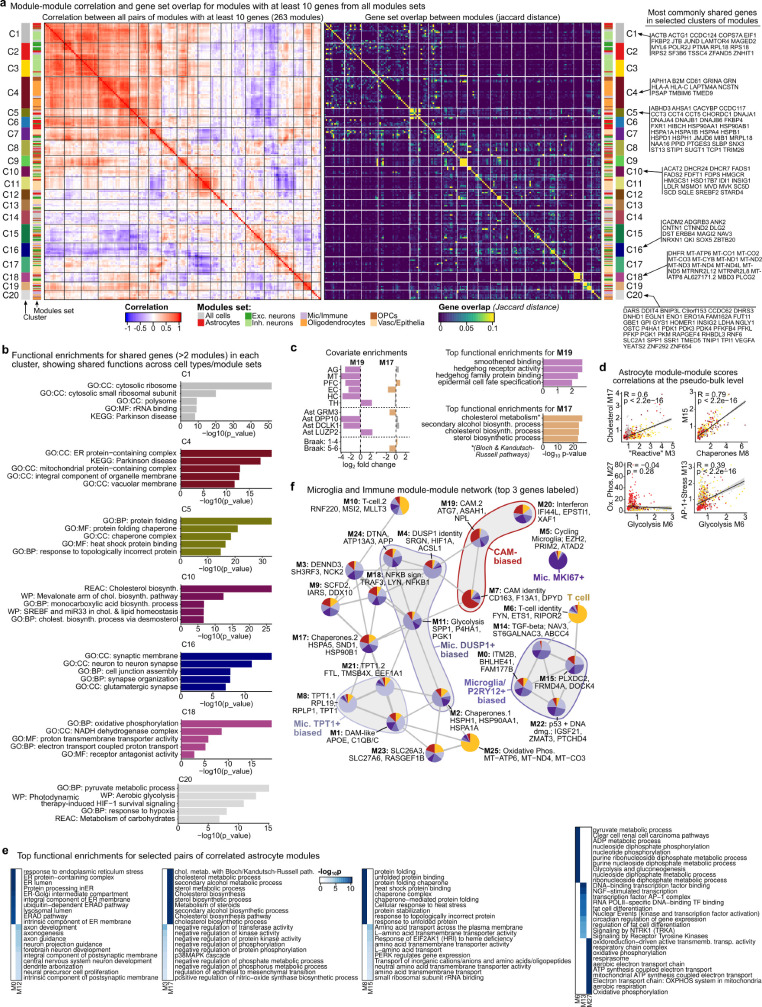
Extended Data Fig. 6. Cross-module clustering and comparison.
a, Module-module correlation (Pearson correlation) and gene set overlap (Jaccard distance) for modules with at least 10 genes from all sets of modules (263 modules in total). Heatmaps are ordered by the hierarchical clustering of the correlation matrix and cuts represent 20 clusters cut from the hierarchical clustering dendrogram. Left and right side bars label rows by their modules set of origin (major cell type colours and grey for all cells). The most commonly shared genes in selected clusters of modules are shown on the right of the gene set overlap heatmap. b, Functional enrichments for each cluster of modules for the shared genes (>2 modules) in each cluster (only clusters with significant enrichments shown). Up to 5 enrichments shown, ordered by p-value, labelled by their source and only keeping terms with fewer than 500 genes. c, Covariate and functional enrichments for example astrocyte modules M19 (thalamus identity program) and M17 (cholesterol metabolism and biosynthesis program). Region, subtype, and covariate enrichments performed at cell level by stratifying cells with z-score > 1 and testing for regional or subtype enrichment (see Methods). Functional enrichments performed using gprofiler2, keeping terms with fewer than 500 genes. d, Scatterplots and correlation of scores for selected pairs of astrocyte modules. Each dot represents the module expression scores for a subtype in a specific sample and is coloured by the astrocyte subtype. Grey area represents the 95% confidence interval around the linear fit. e, Functional enrichments for selected astrocyte modules, showing top 10 functional enrichments for each pair of compared correlated modules (and for M6, M13, M27 together). Only terms with fewer than 500 genes shown. f, Microglial and immune modules network from correlation of module pairs at the subtype by sample level (edges shown where FDR-adjusted p-value < 0.05). Nodes are coloured by module’s relative expression in each of the microglial and immune subtypes and groups highlight sets of subtype-biased modules.

