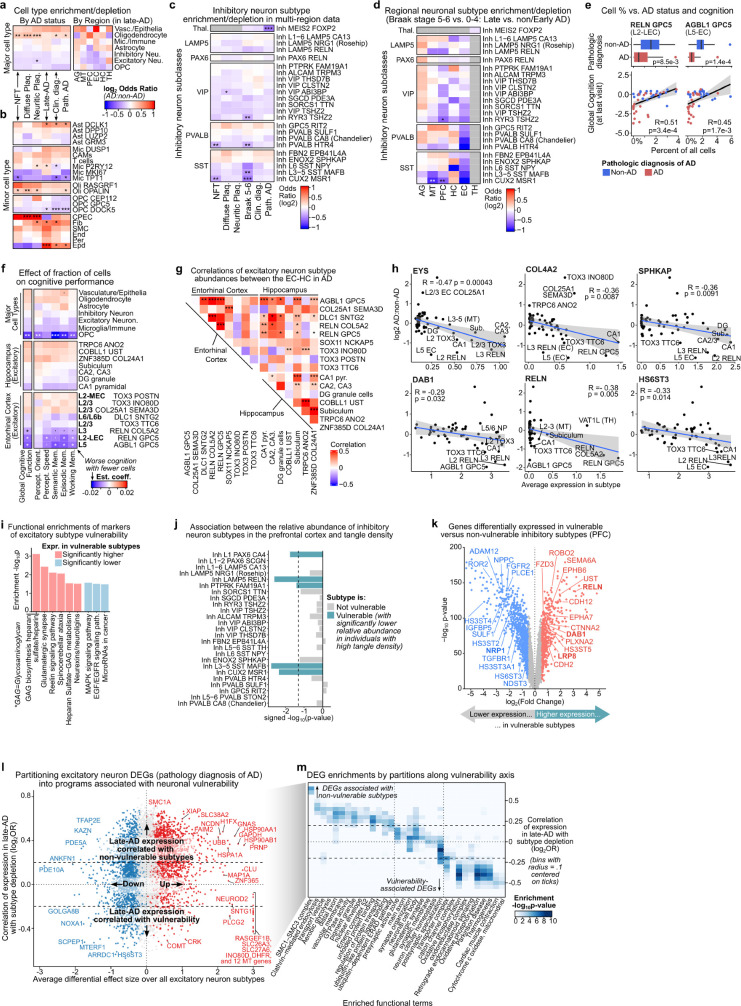
Extended Data Fig. 7. Neuronal vulnerability, connectivity, and markers of vulnerability.
a, Compositional differences for major cell types in AD by quasi-binomial regression with FDR-correction. log2 OR shown both for each AD variable across regions (left) and for each region in late-AD (right). Analysis performed for individual-level AD status and region-level pathology measurements. Pathologic diagnosis of AD (Path. AD) was stratified by NIA-Reagan score (26 AD and 22 non-AD) and clinical diagnosis was stratified as AD dementia (n = 16) and non-CI (n = 32). b-c, Compositional differences for glial subtypes and inhibitory neuron subtypes according to individual-level AD status and region-level pathology measurements (as in a). Grey boxes indicate interactions that are not computed due to MEIS2 FOXP2 specificity to the thalamus, where we do not have measured regional scores. d, Compositional differences in inhibitory neuron subtypes in late AD (Braak Stage 5-6 vs. 1–4) in each region. Grey boxes indicate interactions that are not computed due to subtype regional specificity. e, Boxplots (top) of neuronal fraction for two vulnerable EC subtypes, split by AD status (AD: blue, non-AD: red), with p-values from one-sided Wilcoxon test. Scatter plots (bottom) of individuals’ global cognition at last visit against cell fraction for two AD-vulnerable entorhinal cortex subtypes, coloured by AD. Linear fit with 95% confidence interval shown in grey. f, Estimated effect size of cell fraction (log10) on scores for performance in various cognitive domains at last visit and combined scores from all domains (global). Linear regression FDR-corrected p-values (**adjusted p-value < 0.01, *<0.05, dot is <0.1). g, Full correlation matrix between subtype fraction between the hippocampus and entorhinal cortex in the same individuals, as described in the methods (***adjusted p-value < 0.001, **<0.01, *<0.05). i, Example genes predictive of subtype vulnerability. Scatterplots show average expression in the subtype across individuals against the effect size of the depletion or enrichment in AD as measured by the log2 odds-ratio for late-AD, as in the Methods. i, Functional enrichments and intersected genes for top 30 markers of subtype vulnerability (terms with <500 genes). j, Association (quasi-binomial regression) between the relative abundance of inhibitory neuron subtypes in the prefrontal cortex and the density of neurofibrillary tangles. Association scores (signed negative log10 FDR-adjusted P value, where the sign was determined by the direction (positive or negative) of the association) are shown. The dotted line indicates the significance level threshold of an FDR-corrected P value of 0.05. P values were derived using the glm function in R and adjusted for multiple testing via the Benjamini-Hochberg method. k, Volcano plot showing genes differentially expressed in vulnerable versus non-vulnerable inhibitory neuron subtypes (genes significantly higher in vulnerable subtypes in red, lower in blue). FDR-adjusted P values as determined by the R package ‘dreamlet’ are shown. l, Scatter plot of each tested gene’s average differential expression effect size in late-AD (y-axis) versus the correlation of its expression in a subtype and that subtype’s level of depletion in late-AD (x-axis). Dashed lines separate genes associated with vulnerability and non-vulnerability. m, Functional enrichments for each identified class of neuronal DEGs (terms <500 genes) on bins (along x-axis from l), from genes associated with vulnerability to those associated with non-vulnerability (only genes with biased effect sizes, see Methods). Dashed lines correspond to the same breaks as in (l).

