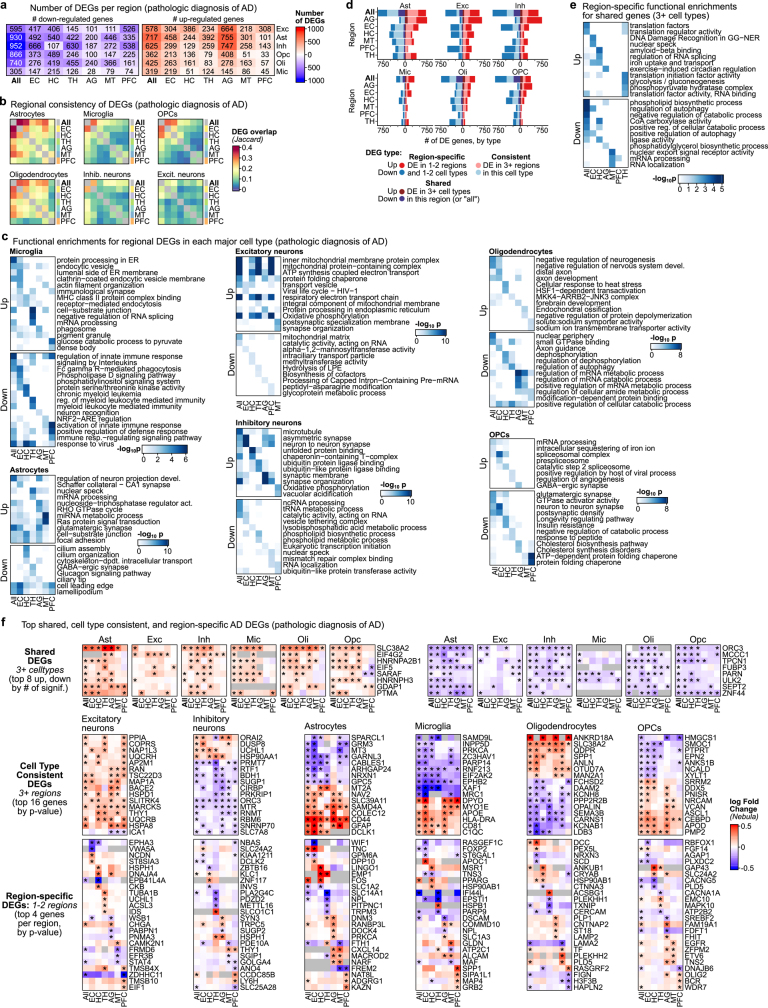
Extended Data Fig. 8. Regional differential expression and GWAS association.
a, Number of up- and down-regulated differentially expressed genes (DEGs) with respect to pathologic diagnosis of AD for each major cell type, calculated in each region separately as well as jointly over all regions. b, Heatmaps of Jaccard similarity of DEGs across regions for each major cell type. c, Heatmap of -log10 p-values for functional enrichments showing the top pathways for AD DEG shared across 3+ cell types. Enrichments shown for DEGs calculated in each region and in all regions together (up to the top 3 pathways per analysis are shown). d, Barplot of number of DEGs per region and cell type, coloured by type of DEG, as determined by its shared differential expression across regions and cell types. e, Top functional enrichments for region-specific DEGs and DEGs shared across regions (≥3 regions) with up to the top 2 terms (<500 genes only) shown per region. Panels shown and computed separately for each major cell type. f, Heatmap of log fold change for top shared, cell-type consistent, and cell+region-specific DEGs in major cell types. GG-NER: global genome nucleotide excision repair.

