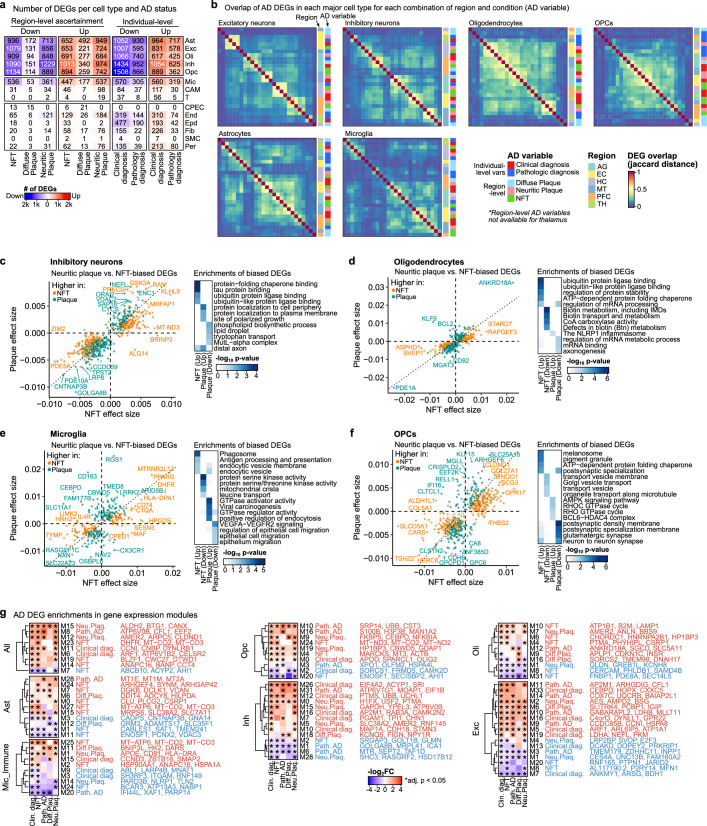
Extended Data Fig. 11. Pathology-biased DEGs for major cell types.
a, Number of DEGs for each cell type for both region-level pathology measurements and individual-level AD status (DE analysis performed over all regions jointly). b, Overlap of AD DEGs in each major cell type for each combination of region and condition (AD variable). DEG overlap computed by Jaccard distance and rows/columns hierarchically ordered by Euclidean distance. c-f, Scatter plots of average effect sizes for NFT and plaque for DEGs with biased differential effect sizes (left panels) and their respective functional enrichments (right panels), for DEGs specific to inhibitory neurons (c), oligodendrocytes (d), microglia (e), and OPCs (f). Genes are coloured by whether they have higher effect size relative to NFT (orange) or plaque levels (teal). g, Heatmap of hypergeometric enrichments of up (red) or down (blue) AD DEGs in modules for DEGs in all sets of modules across all regions, by AD condition. Only modules with at least two significant enrichments are shown and rows are clustered hierarchically by Euclidean distance.

