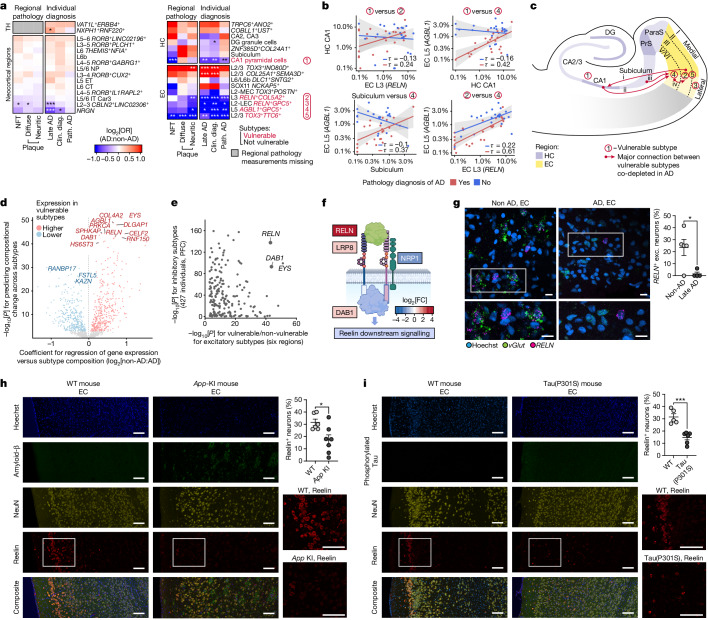
Fig. 3. Subtype-specific neuronal vulnerability in AD.
a, Compositional differences in excitatory neuron subtype enrichment and depletion in AD by quasi-binomial regression with FDR correction. Clin. diag., clinical diagnosis; path. AD, pathologic AD. b, Scatter plot and correlations (Kendall’s τ) of the subtype fraction between four pairs of neuronal subtypes in the HC and EC (linear fit with 95% confidence intervals). c, Schematic of the HC and EC, highlighting the locations of vulnerable excitatory subtypes and co-depleted connections. d, Genes associated with excitatory neuron subtype vulnerability across all brain regions. Linear regression between normalized sample + subtype-level gene expression and log2[OR] for late-AD, with FDR-corrected P values. e, Genes associated with excitatory and inhibitory subtype vulnerability (FDR-corrected P values, only genes significantly and positively associated with excitatory subtype vulnerability). f, Schematic of Reelin signalling pathway genes that are differentially expressed in vulnerable inhibitory subtypes (colour indicates the log2-transformed fold change in expression between vulnerable and non-vulnerable subtypes). The diagram was created using BioRender. g, In situ hybridization (RNAscope) validation of depletion of RELN+ excitatory neurons in the EC of individuals with AD relative to individuals without AD. Representative images (left) include Hoechst (blue), vGlut transcripts (green puncta) and RELN transcripts (magenta puncta). Scale bars, 20 μm. Quantification (right) was performed using unpaired two-tailed Student’s t-tests (P = 0.0242). Data are mean ± s.e.m. n = 5 (non-AD) and n = 4 (AD) individuals. h,i, Immunohistochemistry analysis of Reelin, NeuN and amyloid-β (h) or phosphorylated tau (i) in 12-month-old App-KI mice (h) or 9-month-old Tau(P301S) transgenic mice (i), showing depletion of Reelin-positive neurons in the ECs of the KI and transgenic mice compared with those of the wild-type controls. Representative images (left) show Hoechst (blue); amyloid-β (h; D54D2) or phosphorylated-tau (i) (green); NeuN (yellow); and Reelin (red). Scale bars, 100 μm (h and i). Quantification (right) was performed using unpaired two-tailed Student’s t-tests; P = 0.0181 (App-KI, h; n = 7 (App-KI) and n = 6 (wild type) mice) and P = 0.0005 (Tau(P301S), i; n = 6 mice (Tau(P301S)) and n = 5 (wild type) mice). Data are mean ± s.e.m. ParaS, parasubiculum; PrS, presubiculum.

