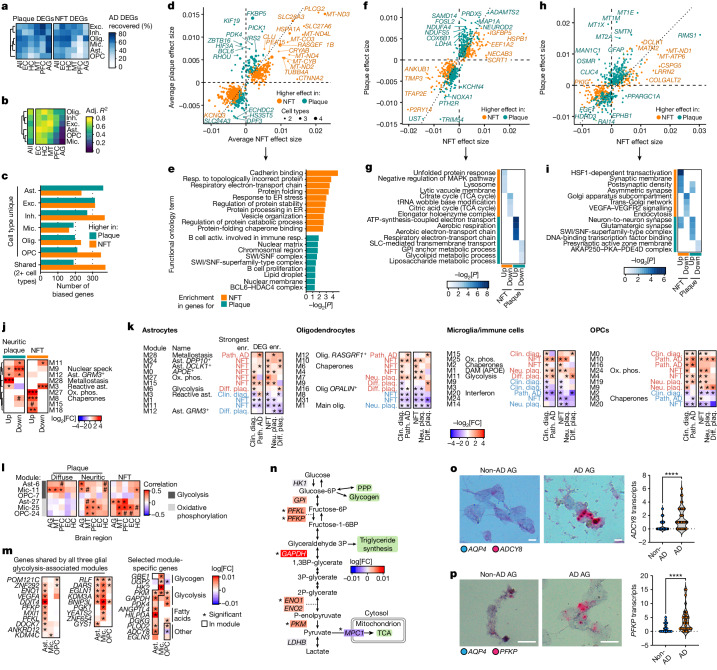
Fig. 4. Gene expression modules annotate and separate AD changes across pathology.
a, The percentage of AD DEGs (pathologic diagnosis) overlapping with DEGs for neuritic plaques (neu. plaq.) and NFTs in each major cell type and region. b, Concordance of effect-sizes between neuritic plaque and NFT DEGs. Adjusted R2 of log-transformed fold changes between neuritic plaque and NFT DEGs in each major cell type and region. c, The number of neuritic-plaque- or NFT-biased DEGs (≥3 DEGs for one of plaques or NFTs, and ≤2 for the other) for each major cell type or shared across 2+ cell types. d–i, The average effect sizes for NFTs and neuritic plaques for DEGs with biased differential effect sizes (d,f,h) and their respective functional enrichments (e,g,i), for DEGs shared across multiple cell types (d,e), in excitatory neurons (f,g) or in astrocytes (h,i). j, Enrichments (hypergeometric test) of pathology-biased DEGs in astrocyte modules. k, Enrichments (enr.) of AD DEGs in glial gene expression modules (*Padj < 0.05, signed log2[fold change], only significant modules are shown). l, Pearson correlation of module scores in each region with region-level pathology measures for glycolysis and oxidative phosphorylation modules in astrocytes, microglia and OPCs (#P < 0.1). m, Core and selected diffuse plaque (diff. plaq.) DEGs in glial glycolysis-associated modules. n, Schematic of the glycolysis pathway, annotated by astrocyte diffuse plaque DEGs. Significant DEGs for diffuse plaques across all regions are indicated by asterisks. o,p, RNAscope validation of astrocyte energy metabolism DEGs in the AG of individuals with AD relative to control individuals without AD (pathologic diagnosis of AD). Representative images (left) show AQP4 transcripts (blue puncta) and ADCY8 (o) or PFKP (p) transcripts (red puncta). Scale bars, 20 μm (o and p). Quantification (right) was performed using unpaired two-tailed Student’s t-tests (ADCY8: n = 117 (non-AD) and n = 76 (AD) cells; PFKP: n = 43 (non-AD) and n = 40 (AD) cells). The dots represent individual cells, pooled from eight samples (four individuals; each had one PFC and one thalamus sample). Activ., activation; DAM, disease associated microglia; ox. phos., oxidative phosphorylation; resp., response.

