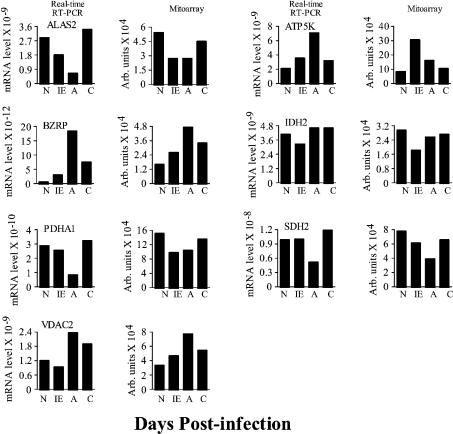
Figure 3. Confirmation of mitoarray expression results by real-time PCR analysis.
Total RNA was isolated from the heart tissue of normal and infected mice and first-strand cDNA synthesized (as in Figure 2). Subsequently, real-time PCR was performed using 2 μl of the 10-fold diluted cDNA as template and gene-specific primers. The results were normalized to GAPDH and represent mean values obtained from two independent experiments using heart tissue of at least three mice/experiment. The S.D. for all the data points was < 12%. All gene names are defined in Table 1. The bar graphs on the left show the relative mRNA level for target genes determined by real-time RT–PCR. 1/2Ct values were plotted on the y-axis. Densitometric quantifications of the mitoarray results are shown in the right panels.

