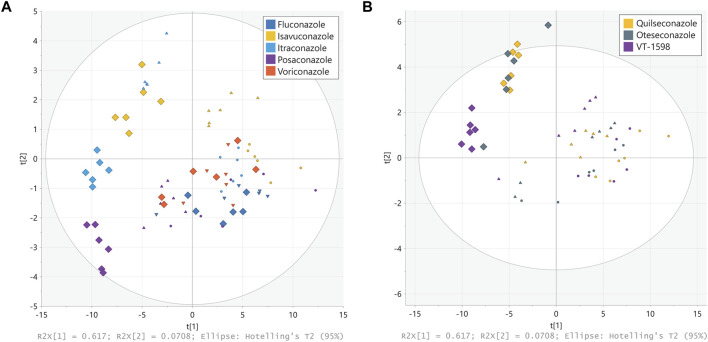
FIGURE 3.
Principal component analysis (PCA) of steroid patterns obtained from H295R cells. H295R cells were treated with different concentrations of triazole (A) and tetrazole (B) antifungals (rectangles displays 3 µM treatment, triangles 1 µM and circles 0.3 µM). Cell culture supernatants were analyzed using an untargeted LC-HRMS approach with steroid annotation and identification. Experiments were performed three times independently, each in duplicate. Results were normalized to the DMSO control. Individual experimental results appear as one point on the PCA scores plot.

