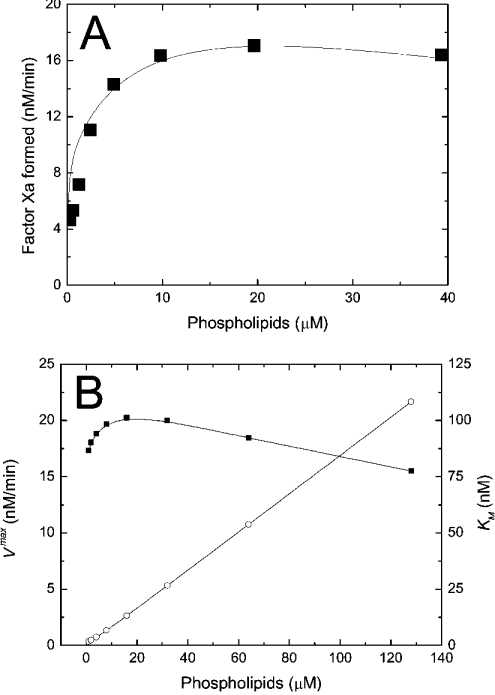
Figure 3. Kinetics of intrinsic tenase on phospholipids.
(A) Dependence of the initial rate of fX activation on concentration of PS/PC (25:75) vesicles. Theoretical dependence (solid curve) is obtained using Model 1 (eqns A34, A24, A27, A28 and A29). The values of the constants are listed in Table 1. The conditions of the experiment were: 200 nM fX, 1 nM fIXa, 0.06 nM fVIIIa and increasing concentrations of phospholipids. Data (▪) taken from [18]. (B) Dependence of the apparent maximal velocity Vmax (▪) and the apparent Michaelis constant Km (○) of fX activation by intrinsic tenase on concentration of PS/PC (25:75) vesicles. The calculations were carried out using Model 1 (eqns A34, A24, A27, A28 and A29). The values of the constants are listed in Table 1. The conditions of the simulation were: 1 nM fIXa, 0.06 nM fVIIIa and increasing concentrations of phospholipids. To find Vmax and Km, the rate of fXa production is calculated at 1, 5, 10, 20, 50 and 100 nM of fX, and the dependence of activation rate on fX concentration is approximated with the non-linear least-squares method (see the Materials and methods section). The solid lines are drawn with the help of B-spline interpolation.

