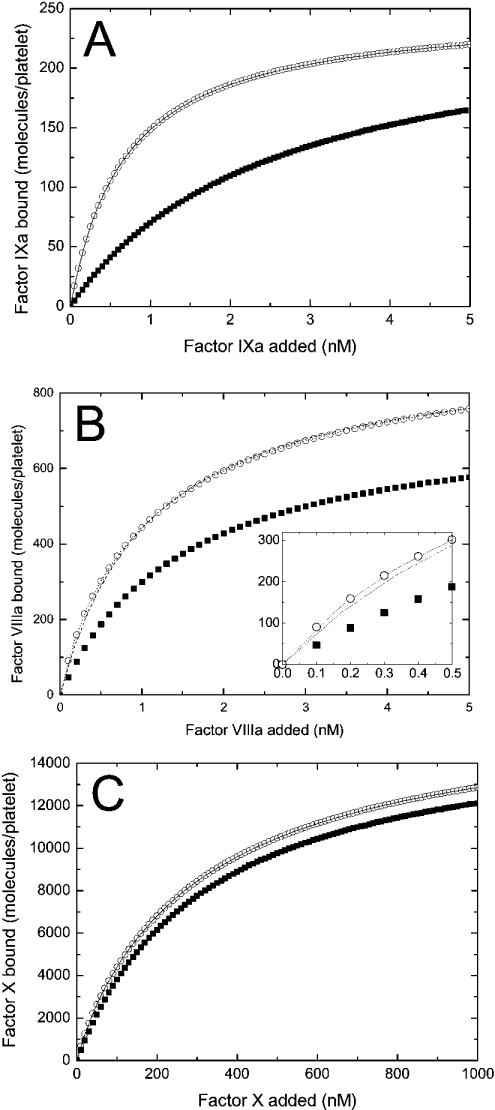
Figure 5. Specific binding of each component of the fX-activating complex to platelets depends on the presence of two other components (theoretical curves).
(A) The binding of fIXa (at indicated increasing concentrations) to activated platelets (2×10⁸ per ml) in the presence (○) or in the absence (▪) of 5 nM fVIIIa and 1500 nM fX. The solid line shows the approximation of the curve (○) with the one-site binding model. (B) The binding of fVIIIa (at the indicated increasing concentrations) to activated platelets (2×10⁸ per ml) in the presence (○) or in the absence (▪) of 45 nM fIXa and 1500 nM fX. The broken line represents the approximation of the curve (○) with the one-site binding model. The dotted line shows the approximation of the same curve with the two-site binding model. The inset shows the low-concentration section of the plot. (C) The binding of fX (at indicated increasing concentrations) to activated platelets (2×10⁸ per ml) in the presence (○) or in the absence (▪) of 10 nM fIXa and 10 nM fVIIIa. The solid line shows the approximation of the curve (○) with the two-site binding model. The calculations of the binding of fIXa, fVIIIa and fX were carried out using eqns A63, A62 and A61 respectively. The constants are listed in Table 2. The binding of fIXa to the shared fIXa/fIX sites is not considered in these calculations. The results of approximations are given in Table 3.

