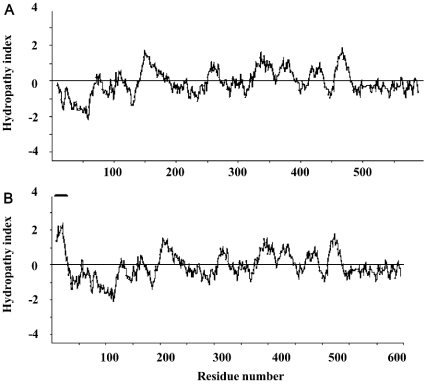
Figure 4. Hydropathy plots suggest that HMGR1 is soluble and that HMGR2 has a single transmembrane segment.
Plots were created using the program Kyte–Doolittle Hydropathy Plots (http://fasta.virgina.edu/o-fasta/grease.htm). Other hydropathy plot programs (such as Hopp–Woods Hydropathy plots, http://bioinformatics.weizmann.ac.il/hydroph/ and Dense Alignment Surface Methods, http://www.sbc.su.se/~miklos/DAS/) revealed the same results. The transmembrane segment of HMGR2 is indicated by a solid bar. Window size is 19.

