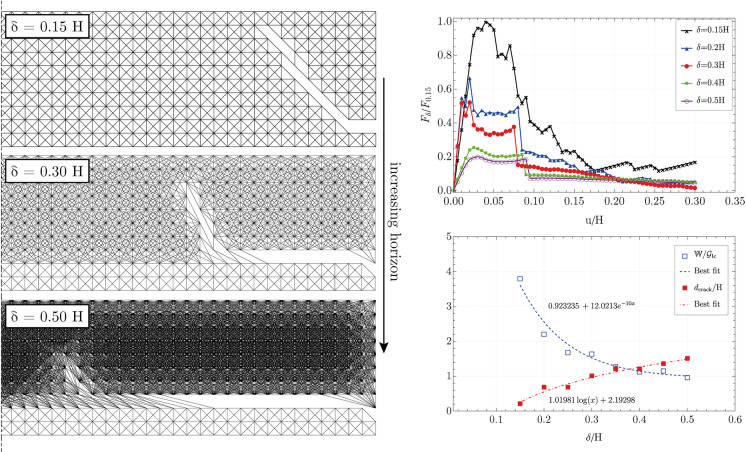
Fig. 8.
On the left: side view of post-mortem specimen subjected to peeling test. The specimen’s upper layers are obtained with an increasing nonlocal character (), whereas the lower layers behave locally. On the right upper part: force versus displacement plots (normalised with respect to the peak force registered among all the different cases) resulting from the peeling test of thin films with varying nonlocal horizons . On the lower right: for various ratios of horizons to thin element height (H), the ratio between the work done to deform the structure at the end of the test and surface free energy () and the length of the crack to plate height ratio (), are reported

