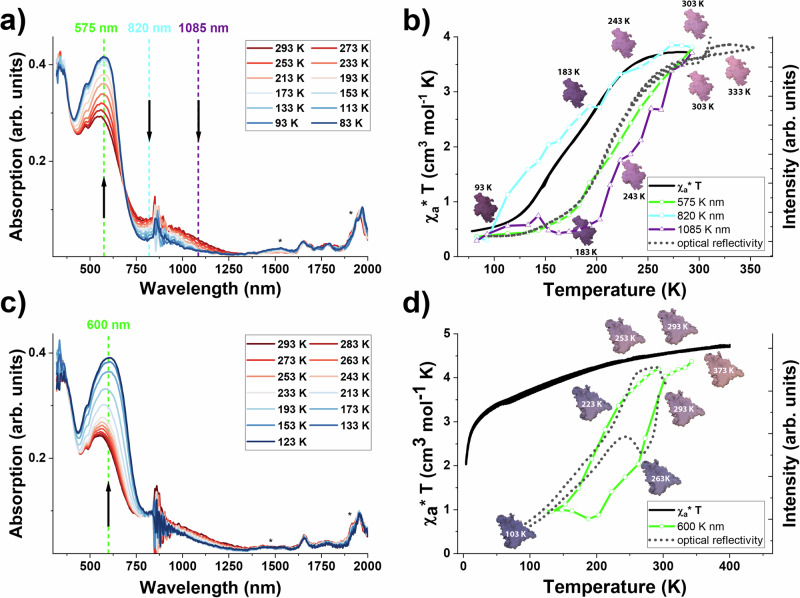
Fig. 5. Temperature dependent UV-vis-NIR absorption spectra of 1a and 4a.
a compound 1a upon cooling and b comparison of the evolution of χaT and optical reflectivity of 1a and the absorption intensities at selected wavelengths as a function of the temperature; c compound 4a upon cooling and d comparison of the evolution of χaT and optical reflectivity of 4a with the absorption intensity at 600 nm as a function of the temperature upon cooling and heating. The absorption intensity scales for 575 nm (b; compound 1a, in green) and 600 nm (d; compound 4a, in green) have been inverted to facilitate a comparison with the optical behavior. The photographs indicate the color of the samples at selected temperatures, clearly showing the observed hysteresis loop in compound 4a. The peaks marked with * stem from water/humidity.

