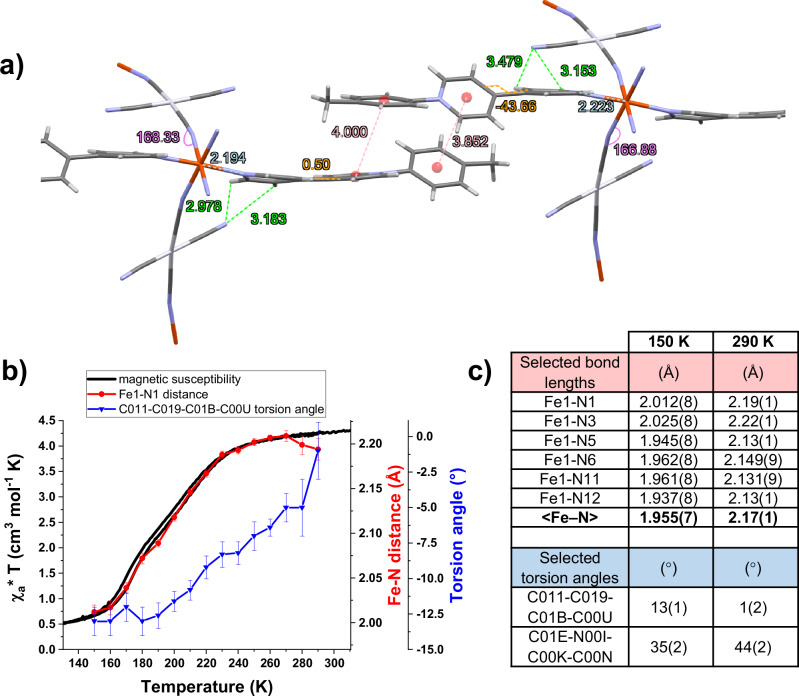
Fig. 9. In-detail crystallographic analysis of compound 1b.
a side view of two π-stacked units of 1b at 290 K, indicating where interactions and structural changes are observed in temperature. Fe-N distances are marked in light blue, the Fe-N-C angle in purple, the π−π stacking and bipyridinium-NC distances in red and green, respectively, and torsion angles in orange. Water molecules are omitted for clarity. b Evolution of the distance Fe1-N1 and the torsion angle of the flat bipyridinium unit (C011-C019-C01B-C00U) upon cooling of 1b compared to its magnetic behavior, error bars designate standard deviation; c selection of metal-to-ligand bond lengths (Å) and torsion angles (°) for 1b at 150 K and 290 K.

