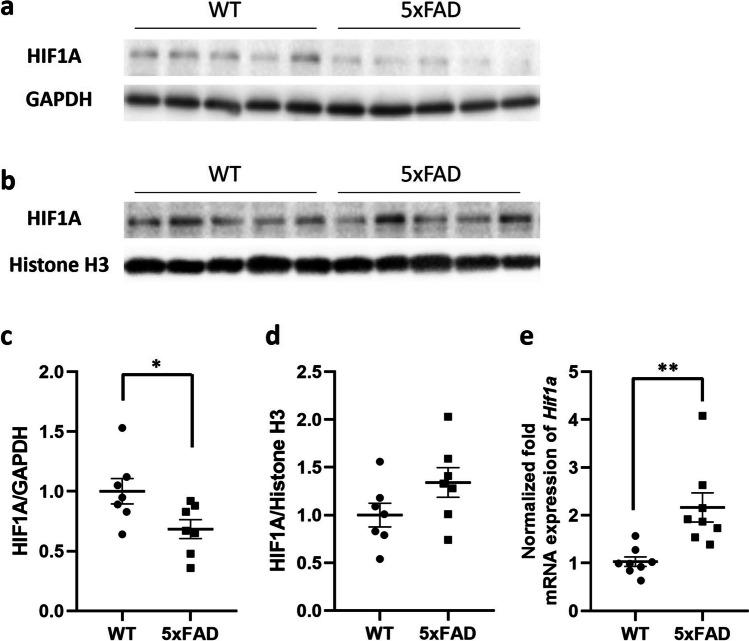
Fig. 2.
a–d Western blot and relative densitometry of HIF1A expression in cytosol (a, c) and nuclei (b, d) isolated from brain cortical samples of 5xFAD transgenic mice versus age-matched wild-type (WT) mice. Data are shown as the ratio between HIF1A and reference loading control. GAPDH was used as a control for cytosol, and histone H3 for nuclei fraction. Each bar represents the mean ± SEM of 7 animals per condition; *p < 0.05 compared to WT mice, Student’s t-test. e Gene expression of hypoxia-inducible factor 1α (Hif1a) in the brain cortical tissue of 5xFAD and wild-type (WT) mice. The data are presented as mean ± SEM of 8 animals per condition. The gene expression was normalized against the beta-actin (Actb) house-keeping gene. **p < 0.01 compared to WT mice, Student’s t-test

