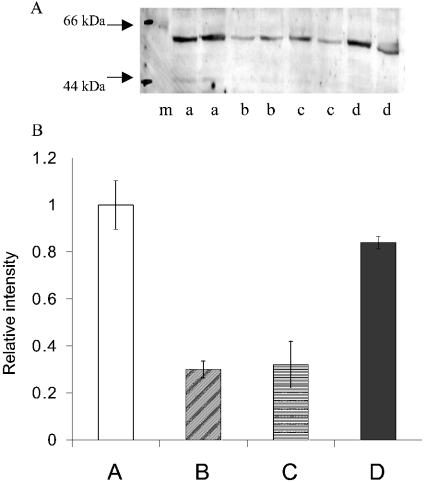
Figure 3. Western blot showing ASCT2 levels in HepG2 cells grown under the conditions shown in Figure 2.
(A) Representative blot. Lane m, molecular-mass markers (sizes in kDa are indicated to the left of the blot); lanes a, control medium; lanes b, medium+PMA; lanes c, glutamine-free medium; lanes d, medium+novobiocin. In each case, 35 μg of cell extract was used. (B) Relative intensity of ASCT2 bands in four separate experiments similar to that shown above estimated using Imagequant. The mean value for cells in control medium was taken as 1, and results are means±S.E.M. A, control medium; B, medium+PMA; C, glutamine-free medium; D, medium+novobiocin.

