Fig. 2.
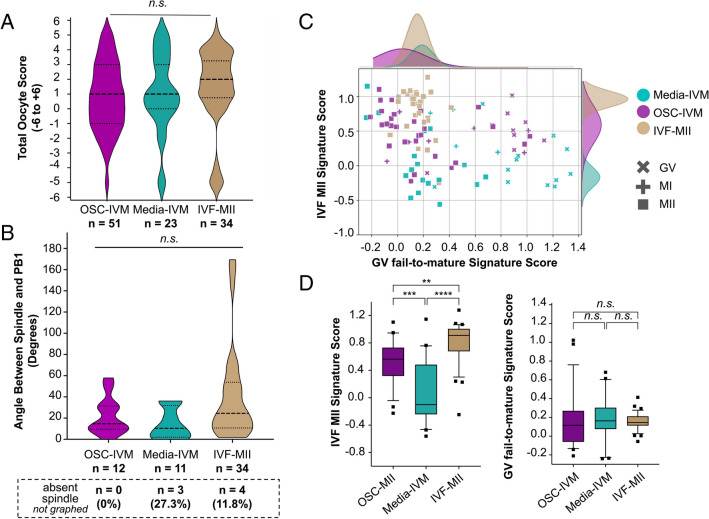
Transcriptomics analysis reveals that oocytes matured under the OSC-IVM condition are transcriptionally closer to IVF MII oocytes than those oocytes matured in Media-IVM, despite no changes in morphological features. A Total Oocyte Scores (TOS) generated from imaging analysis of MII oocytes after 24–28 h IVM experiments and IVF-MII oocytes. n indicates the number of individual MII oocytes analyzed. Median (dashed lines) and quartiles (dotted lines) are indicated. ANOVA indicated no significant (p = 0.5274) difference between the means of each condition. B Quantification of the angle between the first polar body (PB1) and spindle apparatus, derived from oocyte fluorescent imaging analysis (See Supplementary Fig. 2), of oocytes co-cultured with OSCs (OSC-IVM) or in media control (Media-IVM), and IVF-MII oocytes. n indicates the number of individual oocytes analyzed from each condition. Number and percentage (%) of MII oocytes with no spindle assembly observed are also indicated below the axis labels in the dashed box. Median (dashed line) and quartiles (dotted line) are indicated. ANOVA statistical analysis found no significant difference (ns, p = 0.1155) between the means of each condition. C Scatterplot projections of oocyte transcriptomes generated from the GV fail-to-mature Signature Score (X axis) and IVF MII Signature Score (Y axis). Symbols are color-coded based on the experimental condition (OSC-IVM, Media-IVM, IVF-MII), and symbol shapes represent oocyte maturation stages (GV, MI, and MII). Each symbol represents one oocyte. Histograms on top depict distribution of MII oocytes across the GV fail-to-mature Signature Score axis. Histograms on the right depict distribution of MII oocytes across the IVF MII Signature Score axis. Histograms are color-coded based on the experimental condition. n = 114 oocytes. D BoxPlot of distribution of MII oocytes across IVF MII Signature Score (left) and GV fail-to-mature Signature Score (right). ANOVA statistical analysis found a significant difference between the OSC-IVM-MII oocytes and Media-IVM MII oocytes (**p = 0.0003) and between the IVF-MII oocytes and Media-IVM oocytes (****p < 0.0001), as well as between the OSC-IVM-MII oocytes and the IVF-MII oocytes (**p < 0.0026)

