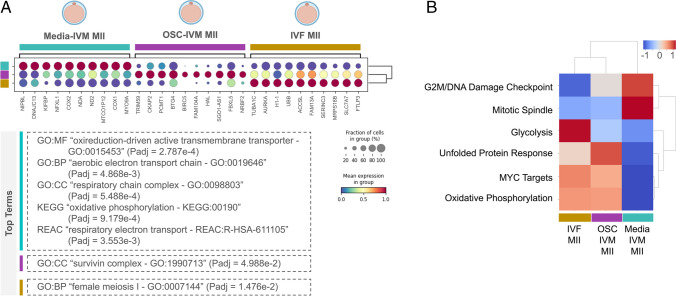
Fig. 4.
Pathway enrichment analysis reveals similarities between MII oocytes rescued from OSC-IVM and IVF-MII oocytes. A Dotplot displaying gene enrichment among Media-IVM MII oocytes, OSC-IVM MII oocytes, and IVF-MII oocytes. The bottom panel shows enrichment of Gene Ontology (GO) terms and KEGG and REACTOME pathways (see an extended version in Supplementary Fig. 7). GO, gene ontology; MF, molecular function; BP, biological process; CC, cellular component; KEGG, KEGG pathway; REAC, Reactome pathway. B Heatmap of Gene Set Enrichment Analysis (GSEA) hallmarks among Media-IVM MII oocytes, OSC-IVM MII oocytes, and IVF-MII oocytes. Heatmap represents row-normalized gene expression using a color gradients scale ranging from higher (red) to lower (blue) relative levels

