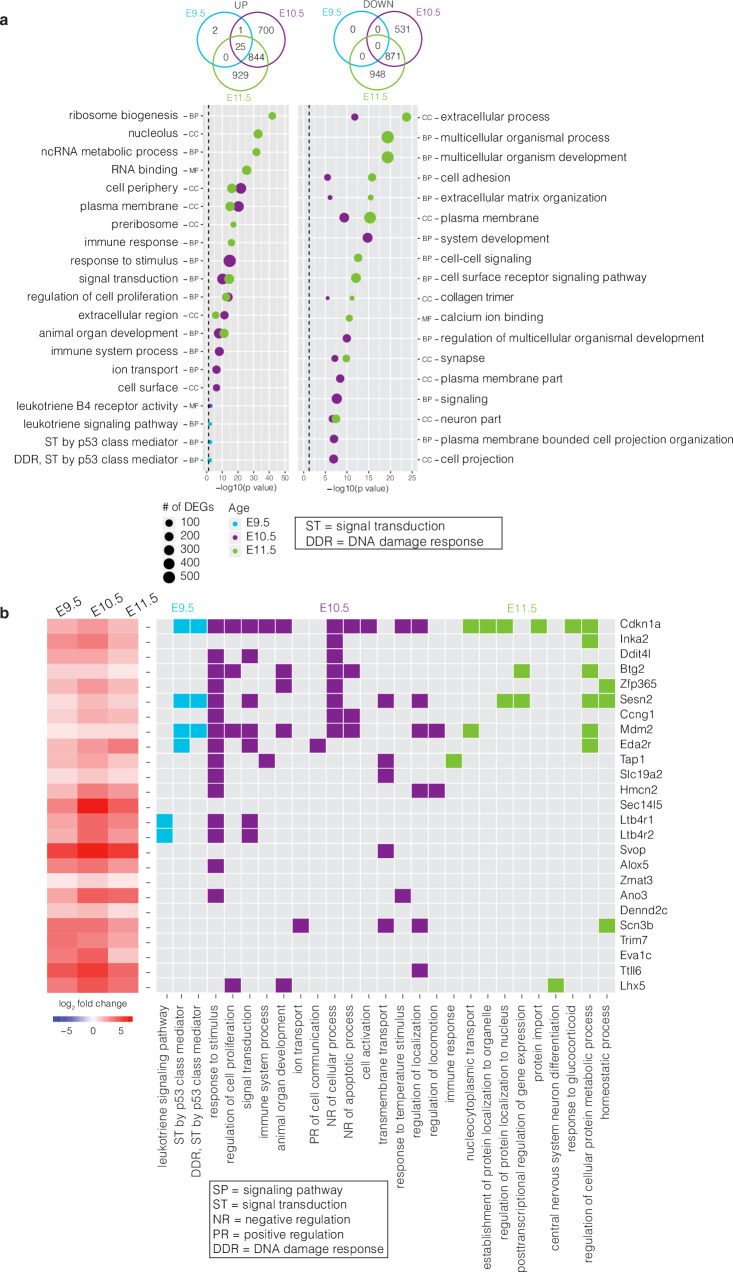
Fig. 2. Bulk RNA-seq profiling of Esco2fl/fl and Esco2fl/fl;Prrx1-CreTg/0 developing limbs from E9.5-E11.5.
a Venn diagram (top) and gene ontology (GO) enrichment (bottom) for upregulated (left) and downregulated (right) DEGs at E9.5 (blue), E10.5 (purple), and E11.5 (green). Gene Ontology enrichment analysis was performed with a p-value ranked query and multiple testing correction by the g:SCS method (p ≤ 0.05). Dashed line indicates the threshold of significance (0.05). BP, Biological Process; CC, Cellular Compartment; MF, Molecular Function. b Heatmap of the average expression changes (log2 fold change) of the 25 overlapping upregulated genes across the three ages. Gene names are to the right of the matrix and GO terms below.

